Eddie Tofpik’s annual FX review – January 2017
“Last year I wrote how I had in the run up to the end of 2015 written quite a few fairly Bearish pieces and that the market had been fairly bearish and that it seemed to be settling into a somewhat neutral state with possible bearish tendencies.’ I went further a suggested in Nov 2015 we have two possible outcomes for the next 12 months” – Eddie Tofpik

By Eddie Tofpik, Head of FX at ADM ISI, and visiting lecturer at the University of Essex
GBPUSD
TREND DOWN
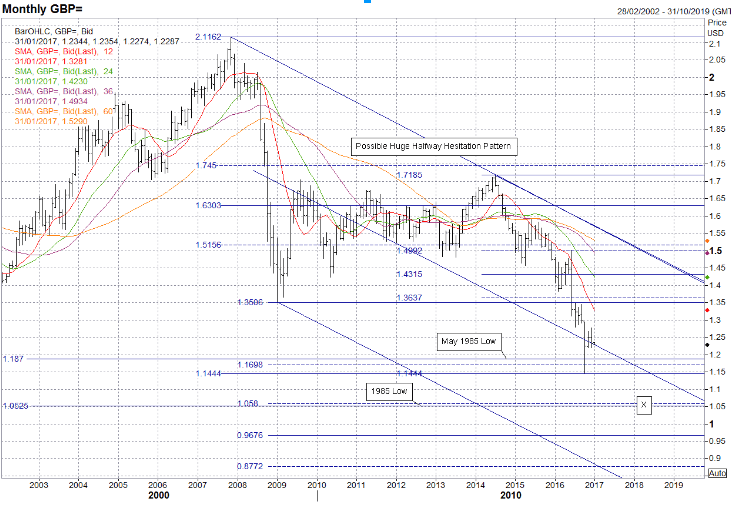
Last year I wrote in my Annual Review referencing the Monthly Charts above ‘Now we have a new low at 1.4559. Nevertheless, this still looks like being tested as well as the 2010 low at 1.3673 and 2009 low at 1.3498. It seems likely we may try these levels and I have altered the bullet point above to take that into account’.
I guess I was overly cautious as despite the veracity of what I had seen & pointed out, I still received many incredulous comments prior to Brexit as to why with all the things happening in the world, did I think Cable would go so ‘low’? Time has proved my comments to be accurate & actually (as mentioned) conservative.
So what now? Well, it may seem strange but I think we may still be following on the action formed back in 2007 – 2009. We may be on the 2nd Leg of a huge Bearish Halfway Hesitation move with a potential target level coincident with the 1985 Low at 1.0525 & the 38.2% Fib Projection of the 2007 – 2009 move at 1.0580 – I have boxed an ‘X’ on the Monthly Chart above to show an approximation.
Given the recent degree of decline, it would seem likely that we try for that this year – 2017. So what could stop it? Well, there are two principle features – the 1st is the Centre Tine of the Bearish Schiff Pitchfork of the same 2007 – 2009 move (currently 1.2267), this drops about 45 tics a month…and is halting pattern as it is a Bearish Pitchfork. The 2nd is the breached but likely still valid support from the 2016 low at 1.1444 up to the May 1985 low at 1.1870.
Neither seems that particularly strong but that are still there. Admittedly, the action since the Flash Crash drop has been somewhat muted in pursuing the Bearish cause but all MAs still point downwards and I see no need at this time to alter the fully Bearish bullet point above. Further support after the 1.0500 area is at 0.9676 & 0.8772 though oddly I do not have parity as a major support at this time. Topside, you’d need at least three consecutive Monthly closes over the recent 50% Fib at 1.4315 to negate the Bearishness.
Interestingly, should we get to 1.0500 then the 50% Fib will drop to the 1.3869 level. still above the resistance formed by the major 2009 low at 1.3506. Further resistance is at 1.2796, 1.3445, 1.3643, 1.3833 & 1.4230.
Last year I highlighted an anomaly on the Monthly Chart above. We had two Key Reversals Down & no follow through…so I left a question on the Chart last time as to whether the action really was a Bearish Halfway Hesitation or a basing action before trying higher.
I even suggested that if prices did try higher then the first target would be a doubling up of the recent action to 0.8100. Well, a basing action is what we had and prices rose up to 0.8100, halted, taking a breather for a couple of months before trying higher still until just short of the Oct 2009 high at 0.941, interestingly during Oct 2016.
Here they formed a Bearish Shooting Star Pattern and fell away, though not too Bearishly as last month it formed an Indecisive Spinning Top Pattern…just ahead of the 1 year MA(currently 0.8304) and seemingly also bouncing up off the 2008 – 2016 50% Fib at 0.8371. In effect, this year is now also presenting its own anomalies.
So where now? All MAs point upwards so I’m obliged to put the bullet point into Bullish but I’ll add a question mark as though the 1 & 2 Year MAs are ascending fairly steeply, the others are not. There is a wealth of support below the market starting at 0.8435, the key 0.8371, 0.8276 Uptrend (dynamic), 0.8227, 0.8173, the very recent 50% Fib at 0.8148 plus more at 0.8097(dynamic), 0.8031, 0.8018(dynamic), 0.7955(dynamic), 0.7861 and a band 0.7836 – 0.7738 before a gap down to 0.7561. This is not wholly but nevertheless substantially balanced out by resistance starting at 0.8560 and then at 0.8711, very key 50% Fib at 0.8836, 0.8961 and then 0.9300 – 0.9488 before a gap till 0.9811.
I would suggest the following at this time – the key 50% Fib currently at 0.8836 needs to be swiftly overcome in the next few months or the strength for a try higher will dissipate. Currently, prices have pulled back towards the mess of support between 0.8303 – 0.8018 with the 50% Fib at 0.8371 also being there on a Monthly closing basis.
A key look out would be any consecutive Monthly closes under the 2015-to-date Uptrend (currently 0.8276) – if this is broken properly then the 0.8303 – 0.8018 band and the further band 0.7861 – 0.7738 will be under threat. However, should the market have consecutive monthly closes over the 50% Fib at 0.8836 then the Oct, Mar & actual 2009 high at 0.9811 could be at threat. In short – pullback to gain support – if it fails then possibly sub 0.7800 area is next…if it works then 1st the 0.9400’s and then 0.9800’s get tested. At the moment…favour a try higher…but it needs to be soon.
EURGBP
TREND UP?
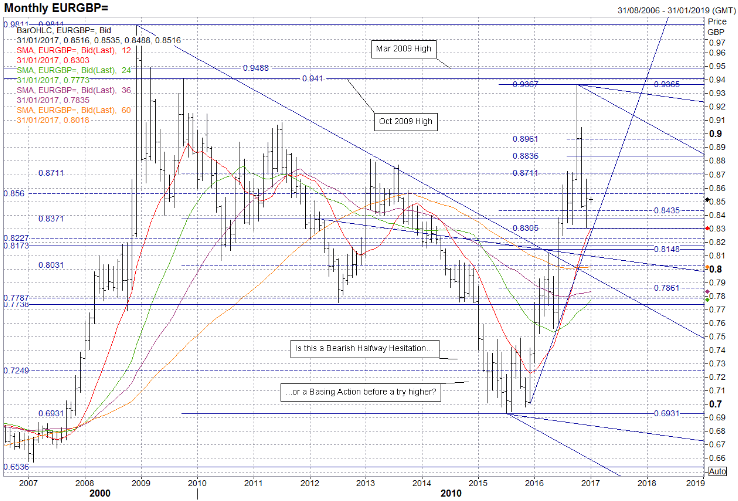
Last year I wrote how I had in the run up to the end of 2015 written quite a few fairly Bearish pieces and that the market had been fairly bearish and that it seemed to be settling into a somewhat neutral state with possible bearish tendencies.’ I went further a suggested in Nov 2015 we have two possible outcomes for the next 12 months.
A Bearish Halfway Hesitation with a potential target marked by X1(0.8225) and coincident with lows back in 2001 – 2002 or 2) A basing action (possibly a Double Bottom but it is too early to say) with a potential target marked by X2(1.3053) on the Monthly Chart above.
Due to all MAs heading down, I feel obliged to make the bullet point bearish but given recent action & a lack of seeming enthusiasm for trying lower I also feel obliged to place a question mark against it.’. For the next ten/eleven months or so pretty much nothing happened as we went sideways within the range roughly 1.0540 – 1.1700…actually that is inaccurate. We seem to have formed a pretty rudimentary sideways pattern (I hesitate to use the word Triangle or Pennant here) indicative of the neutral action the market decided upon.
It is only in the last two month that we’ve seen any potentially clear directional action. The Nov close below and outside of the 2015-to-date Uptrend seemed to indicate a start of something and the following month (Dec), though it was an Indecisive Spinning Top, we still had a new lower close and a new low for the 2nd decade of the 21st Century. If we see a similar propensity for a try lower in Jan 2017 then we could see the start of the next phase in this market – the 2nd leg of a Bearish Halfway Hesitation with potential down to just below 0.8400.
It is not too early to say it but it is too early to be sure. So in the meantime, support is at 1.0456, 1.0353, 0.9853, 0.9666(dynamic), 0.9613 and then seemingly very little till 0.8558 & 0.8225. Resistance is at 1.0538, 1.0641(dynamic), 1.1000, 1.1210, 1.1299 – 1.1365, 1.1521(currently key), 1.1674, 1.1744 & then the twin 50% Fibs (…and very key) 1.2132 & 1.2174.
To slow the move lower you’d need consecutive closes over 1.1744 and to negate the push lower there would have to be consecutive closes over the key 50% Fibs 1.2132 & 1.2174. I’m naturally cautious so I’d need further confirmation but I‘d very much like to move the bullet point above to full Bearish…unless something happens soon.
EURUSD
TREND DOWN?
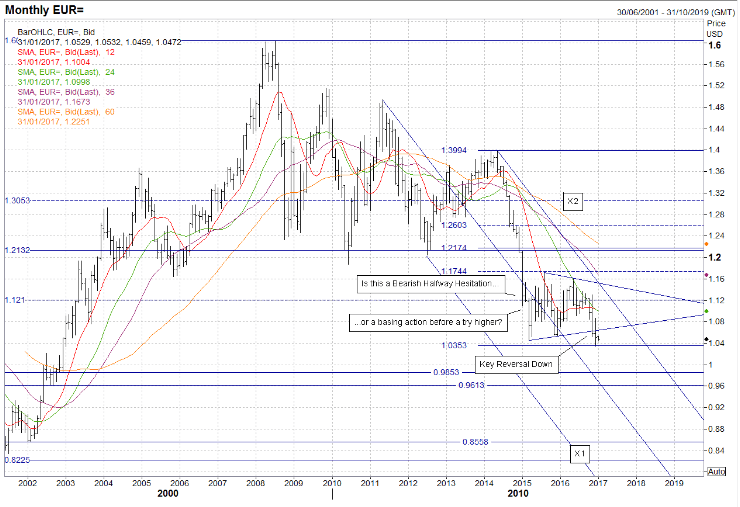
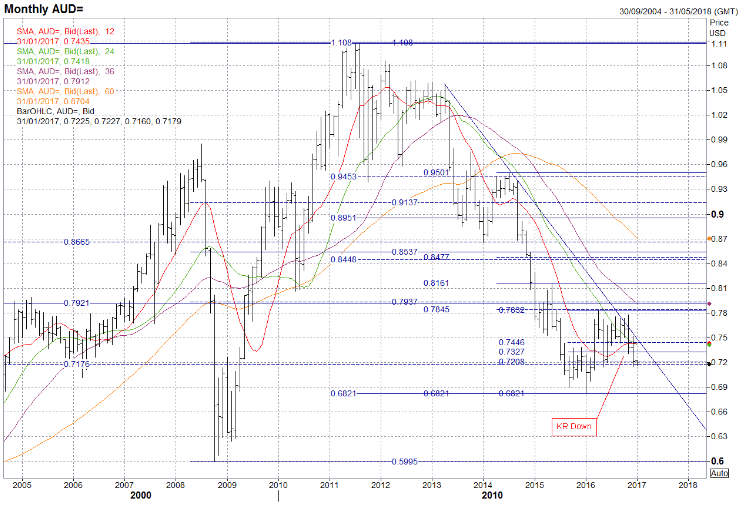
Two years ago I wrote ‘The key is still the 0.7921 50% Fib of the 21st Century. If this has two consecutive closes below on the Monthly Chart then 0.7700 is threatened and if that is threatened then the 38.2% Fib of the 21st Century at 0.7176 is threatened and if that goes then the 2009 low at 0.6245 is threatened and ultimately the big low of the Crisis during 2008 at 0.5995! To sum up, last year we were toppy and heading down, this year we may be just heading down!’.
Last year I added very little as it seemed we may see lower prices at the time and in actually we do have lower prices compared to this time last year…by 45 tics…just in other words.
However, that does not show the whole picture as you can see in the price action on the Monthly Chart above we rallied and broke (though without a close above) the 2013-to-date Downtrend…I think that might still have some validity(currently 0.7534) but the real Bearish pressure came from the previously mentioned 50% Fib at 0.7921.
This halted further tries higher and with the combination of the Downtrend led to last Nov seeing a Key Reversal Down and possibly a new attempt lower this year. We are below the 50% Fib of the 2016 move (0.7327) and though we had a failed try lower in May, I’m minded to think this time it may be more likely…once nearby supports are overcome at 0.7208 & 0.7176 on a closing basis. So, overall the thoughts of two years ago still hold – support other than at previously mentioned levels is at 0.7142, 0.6893 & 0.6821.
Resistance likewise is at 0.7446, 0.7832 – 0.7845, 0.7921 – 0.7937 & 0.8161. With three out of four MAs pointing lower & given my earlier guarded Bearish points, a Bearish bullet point above with a question mark would be appropriate for this market.
AUDUSD
TREND DOWN?
Last year at this time I pointed out how the action in 2015 might possibly be building up to another Bullish Halfway Hesitation as there had been two actual Bearish Key Reversals on the Monthly Chart in 2015 (and possibly even a third) and the market had seemingly rejected then, hence the possible Bullish HH. Even the this side of Jan 2016 I might still have argued the Bullish case with a Bullish Hammer Pattern though with a new recent low at the time I would probably have been cautious.
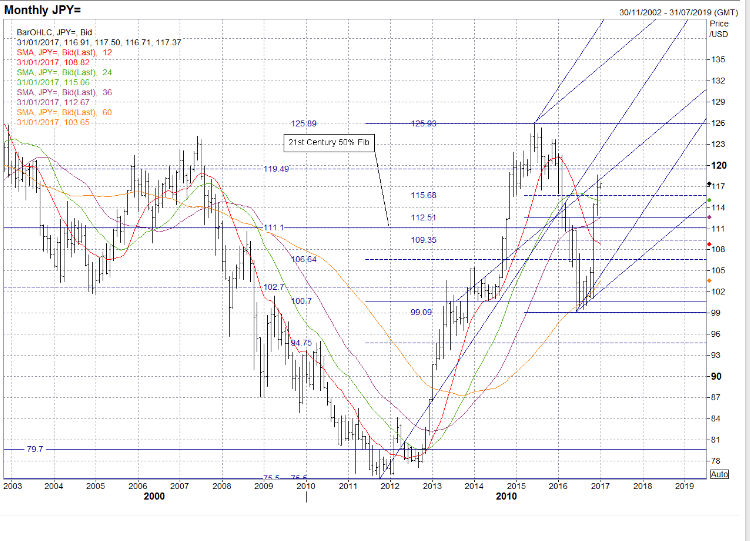
It was only in Feb that the cumulative effects of the Bearish KRs overcome any opportunity for a Bullish HH and we finally started the drop down. We fell back through what I thought would be the important 50% 21st Century Fib support at 111.10 and seemingly felt nothing…which surprised me somewhat. However, the combination of the 50% Fib of the move up from 2012 – 2015 at 100.70 and the support of the 5 Year MA (currently 103.64) helped stop the fall and turn the market back up in the latter stages of 2016 though not yet as far as the heights of 2015.
So where now? Well MAs are mixed with two up and two down. However, I now have the opportunity to draw on the Monthly Chart above both a Bullish Andrews & Schiff Pitchfork which I have done.
This gives the first dynamic resistance currently at about 117.82 with further Tine resistance at 121.71. Actual Tine support is far below the market starting currently at 103.94.
Further support in between is at 115.68, 115.04(dynamic), key recent 50% Fib at 112.51, 111.10, 109.35 & 106.64. Topside resistance is in addition to the previously mentioned levels at 119.49, 123.66, 125.28 & 125.93. As you have read, I recognise the recent recovery after the fall last year.
However, with MAs mixed I would normally place a neutral bullet point above…yet with Bullish MAs and two consecutive closes over the recent 50% Fib at 112.51 I’m minded to think it appropriate to nudge the bullet point above into mildly bullish…with a question mark.
USDJPY
TREND UP?
Last year I gave a Bullish tint to the market as it looked like we may see opportunities for a new post 2015 high yet I tempered it with the following possible scenario ‘…this action is topping and we head back down so then the target area would be something like the 61.8% Fib at 3.0639 from the 2002 – 2011 move. Possible but currently somewhat unlikely.’.
Well the unlikely possibility turned out to be the actual direction though not all the way to 3.0639 as we halted just under the Fib at 3.2087 and with most Monthly closes around the key 38.2% Fib at 3.2087. Most recently we tried higher in Nov and have seemingly failed with a possible Pipe or even a Tweezer Top in Dec.
So what next? Well, we’d need to see prices closing consecutively over the key recent 50% Fib at 3.6735 if there is to be any Bullish incentive, otherwise the lows at 3.1005 beckon…I suspect the lower incentive may develop further. Support other than previously mentioned levels is currently at 3.2087, 3.0914(dynamic), 2.8872(key), 2.6948(dynamic), 2.5792(dynamic) & 2.5656.
Resistance is currently also at 3.3897(dynamic), 3.4446(dynamic), 3.5383, 3.5639(dynamic) & 3.8088. Finally, I recognise the opportunity to draw both Bullish Andrews & Schiff Pitchforks on the action of the last few years. However, I am loathe as I do not think it is a completed move as yet and would defer till it becomes clearer. With three out of four MAs pointing higher I feel obliged to make it a Bullish bullet point above yet I also feel this may turn out to be inappropriate…we’ll see!
Definitions:
TREND UP Any one or more of the following may occur! Market has turned upwards/risen & is likely to carry on, usually till at least the next Monthly Foreign Exchange Commentary. Moving Averages (MA’s) are pointing higher or have either crossed, formed a ‘Golden Cross’ or based out. Chart patterns & trendlines (Channel, Support, Andrew’s Pitchfork, etc…) point higher. No appreciable resistance levels (Fibs, Historical, etc…) are noted.
TREND UP? Any one or more of the following may occur! Market exhibiting signs of exhaustion after a recent rally. Prices may be achieving an upside/downside target level or approaching major/strong resistance. Market may have started/completing a rally/recovery and it may be looking indecisive/going sideways or it is too early to tell in the short, medium or long-term charts. Moving Averages (MA’s) may point higher or have positive crosses but the picture is not conclusive.
Some, but not all chart patterns & trendlines (Channel, Support, Andrew’s Pitchfork, etc…) indicate higher. Appreciable resistance levels (Fibs, Historical, etc…) are noted close to the market.
TREND? – Any one or more of the following may occur! Market exhibiting neither a bias for a rally or a decline. Market is either nowhere near or alternatively caught within narrow bands of support/resistance. Moving Averages (MA’s) point sideways & indicate no immediate likelihood of crossing. No strong chart patterns or trendlines evident. …Sometimes… I frankly haven’t a clue!
TREND DOWN? – Any one or more of the following may occur! Market exhibiting signs of a recovery after a recent fall. Prices may be achieving an upside/downside target level or approaching major/strong support. Market may have started/completing a decline/fall and it may be looking indecisive/going sideways or it is too early to tell in the short, medium or long-term charts. Moving Averages (MA’s) may point lower or have negative crosses but the picture is not conclusive. Some, but not all chart patterns & trendlines (Channel, Support, Andrew’s Pitchfork, etc…) indicate lower. Appreciable support levels (Fibs, Historical, etc…) are noted close to the market.
TREND DOWN – Any one or more of the following may occur! Market has turned down/fallen & is likely to carry on, usually till at least the next Monthly Foreign Exchange Commentary. Moving Averages nN(MA’s) are pointing lower or have either crossed, formed a ‘Dead Cross’ or topped out. Chart patterns & trendlines (Channel, Support, Andrew’s Pitchfork, etc…) point lower. No appreciable support levels (Fibs, Historical, etc…) are noted.