How do you define your VIPs?

This is a guest editorial which has been composed by Pini Yakuel, CEO and founder of automated customer retention solutions company Optimove. Most brokers define their VIPs according to a fixed spend  or activity amount, or by fixed percentiles (e.g., the top 5% of traders according to a given metric). Sometimes, the cut-off point is […]

How do you define your VIPs?

This is a guest editorial which has been composed by Pini Yakuel, CEO and founder of automated customer retention solutions company Optimove.

Most brokers define their VIPs according to a fixed spend  or activity amount, or by fixed percentiles (e.g., the top 5% of traders according to a given metric). Sometimes, the cut-off point is determined according to the staff and resources available for VIP management: you can handle only so much.

Defining the VIP group is a constant struggle. On the one hand, underestimation will result in the loss of important customers and customer value. On the other hand, overestimation will result in squandered marketing dollars.

Customer modeling is the best way to achieve a data-driven, real-time model of your VIPs that stays relevant with the dynamic nature of your business. If you are not using a customer retention solution you might like to try this Excel-based method for defining your VIPs.

This method uses a LN transformation and trendline to identify data outliers. The percentiles which violate the trend at its extreme are those which do not adhere to what we would expect of them under “normal” circumstances. This is the dynamic group of outliers which make up your VIPs. This Excel-based technique offers flexibility in determining the extent of difference between regular customers and VIPs, and allows you to further explore this group in order to achieve a more granular understanding of VIP behavior.

Here’s how to go about it:

  1. After choosing a customer metric, divide your active customer base into 100 percentiles of average values, from lowest to highest (using only positive values larger than 1). The 100thpercentile will have the highest value.
  2. Calculate the values’ Logarithm (“LN”).
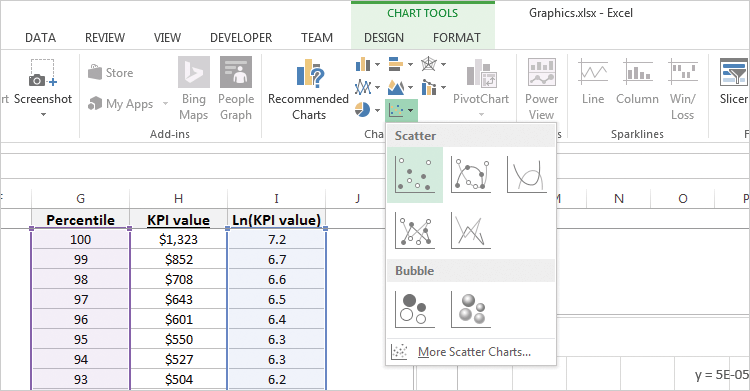
  3. Use a scatterplot to graph the percentiles (X) and LN values (Y).

Picture1

  1. Add a trendline and format it as polynomial of Order 2.

Picture2

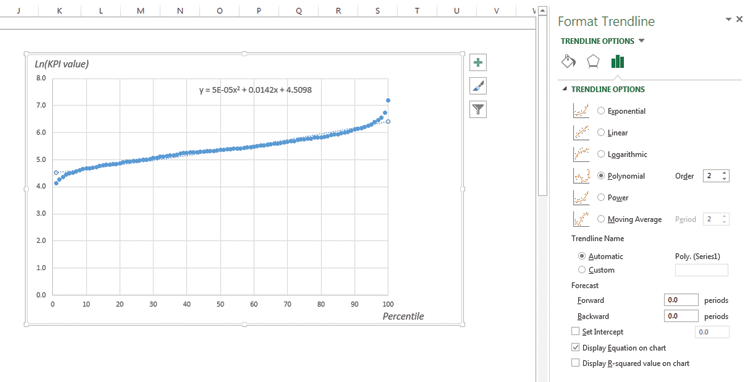
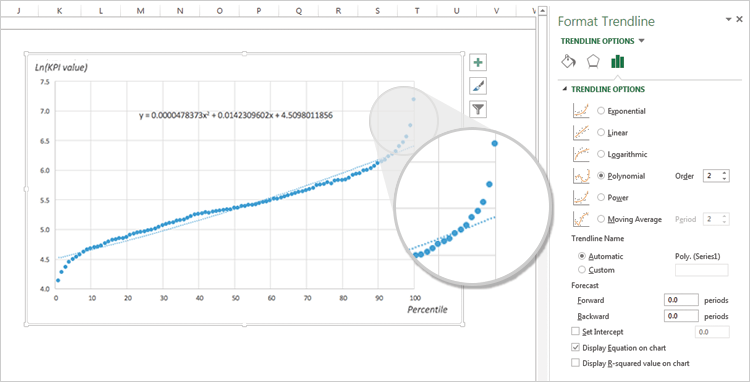
  1. The dots at the extreme right of the scatterplot violate the trend and are thus your “outliers,” your VIPs.

Picture1

For a detailed presentation of this method and additional tips for achieving a more granular understanding of your VIP groups and their behavior, download A Better Way to Define your VIPs – A Step-by-Step Guide.

In a highly Pareto industry, VIPs are one businesses’ biggest assets. Making sure that you’re giving the right thought to this valuable segment should be one of your top priorities.

Read this next

Industry News

FIA urges CFTC to regulate use cases rather than AI itself

“We urge the CFTC to refrain from crafting new regulations that generally regulate AI because this approach presents certain well-known pitfalls. By approaching the issue from the perspective of AI as a technology, rather than the use case for the technology, corresponding regulations would likely necessitate a definition of AI. We anticipate that any attempt to properly define AI would be very challenging and require considerable resources.”

Education, Inside View

The Power of Public Relations in Finance: Shaping Perceptions & Building Reputation

It’s safe to say that the finance industry has faced its share of reputation crises over the years, from the 2008 financial collapse to the many scandals around irresponsible lending, political corruption, and even Ponzi schemes. 

Digital Assets

Crossover’s crypto ECN executed over $3 billion in Q1 2024

“Our growth is also driving continued increases in the percentages of trades that are ‘Order Crossing Order’ (OXO). Currently, roughly 10% of all trades executed on CROSSx are OXO, another differentiator in our platform’s capacity. This capacity and our unique execution model provide value to both the market maker and taker, as evidenced by our commercial model.”

blockdag

BlockDAG’s Explosive Presale Hits $20.3M In April Swaying Investors From XRP’s Price Trends Upward, & Polygon’s NFT Market

Learn about BlockDAG’s impressive $20.3M presale results, XRP’s price increase prospects, and the booming NFT market on Polygon among the top 10 cryptocurrencies.

Retail FX

Financial Commission warns of Eplanet Brokers

The Financial Commission, a self-regulatory compliance specialist for the financial services industry, is ramping up its scrutiny of unregulated brokerage firms. Today, the independent association warned against a company called Eplanet Brokers.

Retail FX

Dubai crypto exchange steps into prop trading

Dubai-based cryptocurrency trading platform, CoinW Exchange, marked its sixth anniversary by announcing a rebranding initiative and launching a proprietary trading product.

Fintech

Bitcoin payments app Strike launches in Europe

Bitcoin blockchain-based payments app Strike launched in Europe on Wednesday, allowing users in the region to buy, sell, and withdraw bitcoin (BTC).

Chainwire

Bandit Network’s Points SDK and Brave Ads Power Astar zkEVM’s Quest Platform “Yoki Origins”

“Yoki Origins,” supported by Bandit Network and Brave Ads, introduces a gamified and rewarding experience for Astar zkEVM users, marking a significant milestone in Web3 adoption.

Digital Assets

Crypto ETFs to debut in Hong Kong next week

Hong Kong has authorized six cryptocurrency-based spot ETFs set to launch on April 30, according to Bloomberg.

<