IG enables traders to add drawings to indicator study area
Traders get to combine drawings and indicators on charts in the desktop and mobile version of the IG platform.

Electronic trading major IG Group Holdings plc (LON:IGG) keeps expanding the list of functionalities of its trading platforms, with the latest set of improvements focused on charts and technical analysis.
Traders can now add drawings to the indicator study area both on desktop and mobile versions of the IG charts. This new functionality has been developed on the back of client feedback submitted to the IG Community, from within the dealing platform.
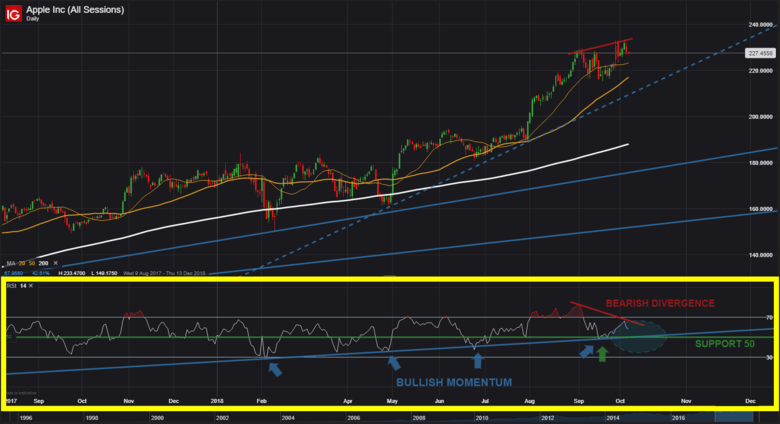
For instance, traders can get more insight from an RSI indicator by drawing a trendline directly on the study area. The ability to draw on these indicators, such as MACD and volume, opens up a number of new options for technical analysis. Trends, for example, can add granular insight into market dynamics and can help improve the accuracy of their TA and strategy.
In addition, the broker has added the measure tool to the mobile charts and made it persistent on the screen so that it does not disappear when a trader taps or clicks away. Furthermore, the usability of the charts has been improved so that traders cannot move their drawings by mistake when moving their charts sideways. To move a drawing, a trader would need to explicitly select it first.
There are some planned enhancements too. The IG team has added the option to activate or deactivate the snapping on the candles. This should be rolled out around mid October.
Let’s note that recent enhancements to the IG web platform have also been focused on working with charts. In July this year, for instance, the broker enabled traders to partially close positions via charts.
The feature is available on charts for both the web trading platform and on mobile. When ‘1-click dealing’ is not enabled, traders are able to confirm whether or not they want to close the whole position, or to partially close via a pop up dialogue box. To use this functionality, traders must click ‘close’ (1) on the chart, change the ‘Sell’ value (for example in the screenshot below they can change 4 to 2 to only close half the position), followed by ‘Submit’. The window will show the ‘Closing P&L’ as well as the ‘Margin Returned’.
In April, IG added a new “Go To” feature to its web platform charts. It allows users to search for a specific date (and time) on a chart in a few simple clicks. The charts will then automatically centre on the searched date/time requested by the user. And in May this year, IG improved this feature. Traders got the ability to see where on the charts is the candle/point in time that they searched for. This information showing the date/time will stay on the screen a few seconds before fading away.