IG enables users of new web platform to pre-set timeframes
The latest series of upgrades to IG’s new platform includes giving traders the ability to pre-set a timeframe.

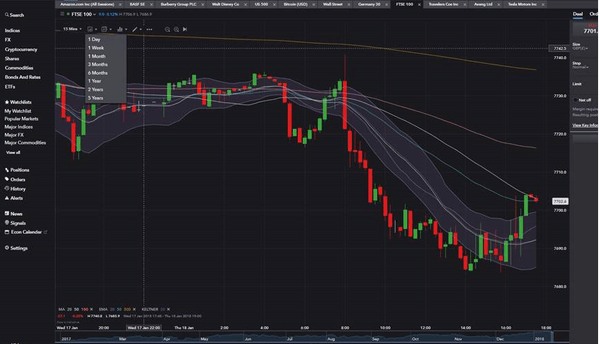
Electronic trading major IG Group Holdings plc (LON:IGG) continues to gradually enhance its new web trading platform. The latest enhancements include a new feature that enables traders to pre-set a timeframe.
This means that traders can select to view data for 1day, 1 week, 1 month etc up to a period of 5 years. Once they have selected the timeframe of their choice, the chart will reload and snap to the selected period. Traders can make use of the pre-set timeframes by clicking on the calendar icon.
In addition, IG’s team has released a new feature on the mobile platform and new web trading platform allowing traders to add text annotations. Some of the text annotation features include setting the font size, font colour, background colour and border type/colour. Traders can create the text annotation by accessing the drawings section of the chart.
Also, a new feature on the web trading platform concerns colors: a pre defined colour palette will come up when traders select the change colour option. Traders can still create custom colours by clicking on the button “more colours”.
In October last year, IG introduced ‘Indicator’ alerts to the platform. These can be added via the ‘Alerts’ tab on a chart. The move was in line with the roll-out of other new features for technical analysis fans. For instance, in August last year, the new web trading platform gave traders the opportunity to make use of up to eight Moving Averages. And in May, IG responded to client requests by introducing Fibonacci extensions to the new platform charts. Traders can access this feature from the drawing tools menu on the new charts. In July, the broker added an Elliott Waves tool to the new platform charts. It can be found in the drawing menu at the top of the chart, or by right-clicking on a chart. Traders can then pick five points on the chart to form the drawing.