IG releases another charting update
The feature provides traders with a brief overview of the indicators on the IG platform.

Electronic trading major IG Group Holdings plc (LON:IGG) has recently released a charting update which provides traders with a brief overview of the indicators on the IG platform and informs them how they can use the indicators to get the most out of their technical analysis.
The company plans to roll this out imminently for the various drawing tools it has on the platform as well.
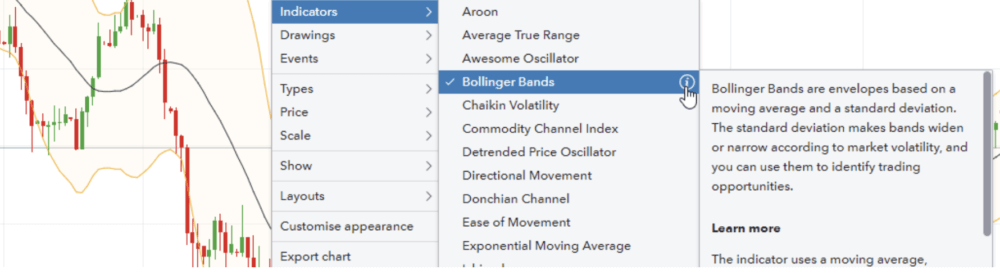
To access IG indicator descriptions on charts, traders have to either right click on the chart and select ‘Indicator’ or use the ‘Indicator’ button at the top of each chart. Then, they have to bring up the indicator they want more information on by hovering over it. A little ‘i’ symbol will appear when a trader hovers over each indicator.
Hovering over this information button will bring up the relevant info. Traders can scroll on these boxes.
Earlier this month, the broker unveiled a new feature traders may use when trading on mobile and desktop. Traders can now quickly and easily see the percentage movement on any given period for any market. This is accessible from the ‘Other Options’ drop down, or by right clicking on the chart, and selecting ‘Percentage’ from the ‘Scale’ option.
In April this year, IG enabled its clients to use a ‘drag and drop’ functionality to set the stops and limits on charts before a trader has placed a trade. This is available for anyone who has ‘Position Preview’ enabled.
The company has also added a further row to HLOC data to share % Change. Bringing up HLOC data requires a right click, followed by Show > HLOC Data. Once selected, hovering over the chart candlesticks should bring up the required information.
In February, in an effort to make its trading platform easier to navigate, the brokerage made the ‘show’ button easier to find by adding the toggle to the top of the charts. By clicking this button, traders will be able to customize the information that appears on their charts. These functionalities were previously available by right clicking on the graph, however due to significant and continued client use they are now only one click away.