“It depends how thick your crayon is” says Eddie Tofpik
By Eddie Tofpik, Head of FX at ADM ISI and visiting lecturer at the University of Essex What is happening to GBPUSD, and what is the trend? Last month I mentioned how I would ‘…readdress the whole issue once we get to 1.4052 again.’ – the old March lows. Well we got there and we […]

By Eddie Tofpik, Head of FX at ADM ISI and visiting lecturer at the University of Essex
What is happening to GBPUSD, and what is the trend?
Last month I mentioned how I would ‘…readdress the whole issue once we get to 1.4052 again.’ – the old March lows. Well we got there and we broke down though it and made new lows. However…and it is a big ‘However…’, we only managed one close below the previous lows at 1.4052 AND other nearby closes were ABOVE the March closes at that time.
All this plus a Bullish Matching Pattern was enough to turn things back around along with the bullet point above into neutral. Since then we have seen the market turn back up further by testing and breaching the Mar high and now testing the Feb high. During the move up we’ve formed a Reverse H+S Pattern but with a ‘ragged’ 2nd Shoulder.
I’ve marked with an ‘X’ a potential target for such a move on the chart at just short of 1.5100. Yet there are some significant resistances between 1.5100 and where we are now. Notably the Feb 2016 high at 1.4668, the Aug 2015-to-date Downtrend (currently 1.4658), the Upper Tine of the Jul 2014 – Apr 2015 Andrews Pitchfork (currently 1.4749) and of course the Long MA (currently 1.4865).
Additionally, I have drawn a new bullish Andrews Pitchfork based on the action of very late Feb through to Apr which seemingly may show the current angle of attack…but the Middle Tine of this analysis in itself is also proving some resistance currently at 1.4752…though it is rising.
There are other resistance points as well but these are the main ones I am concerned with.
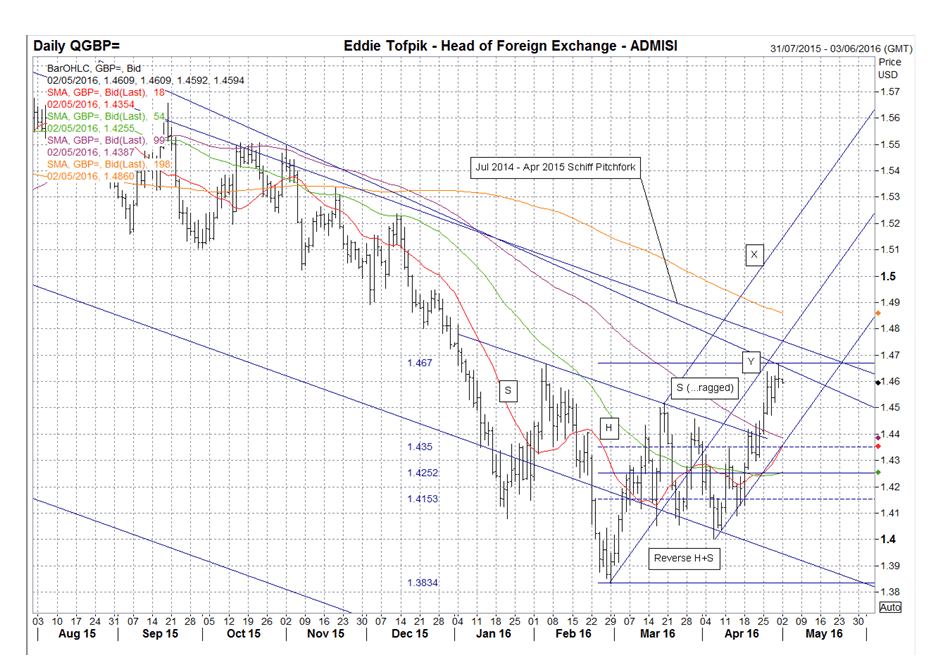
Support is currently at 1.4514, 1.4477, 1.4458, 1.4418, 1.4392 (dynamic), 1.4350 (combined & dynamic), 1.4298 & the current 50% Fib (dynamic) at 1.4252. I would also add the point ‘Y’ on the Daily Chart above.
That is the target should all the action since late Feb just be a sloppy Bull Flag…in which case we are just about there. Overall, I am not surprised that we had a new high at the end of the month…a sure bullish sign…but also neither am I surprised that we had an indecisive Doji Cross there as well.
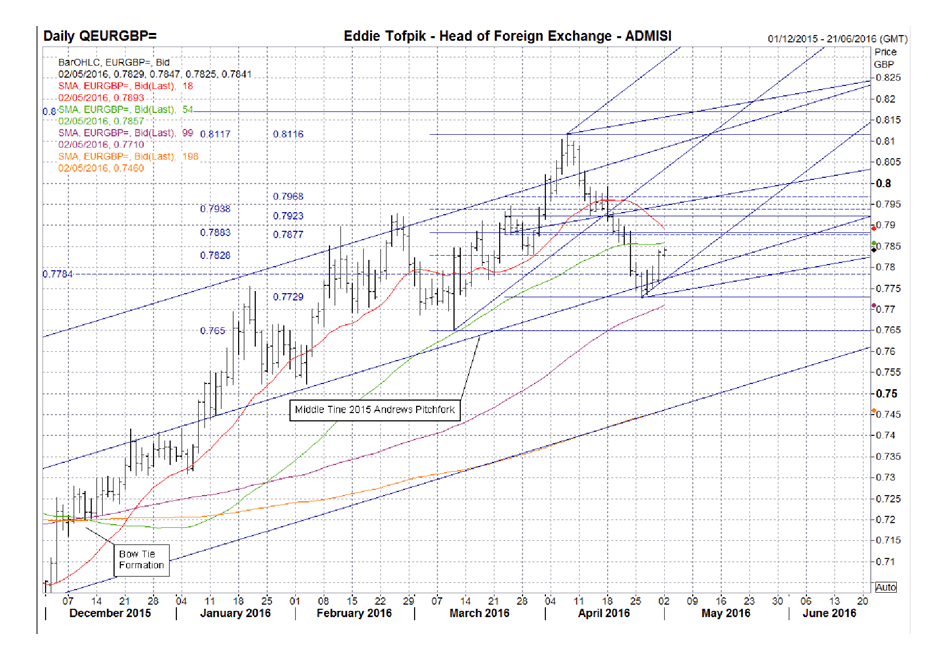
Last month I said ‘To be honest, to halt the move up temporarily you’d need consecutive closes under 0.7835…and that is without making a new high (that would compromise the support by making it higher). To make it neutral you’d need to have consecutive closes under the Medium MA (currently 0.7541) and to make it bearish you’d need consecutive closes below the Long MA (currently 0.7371). So look to the upside and the AP & SP look interesting.
Well, we have halted the move higher by consecutively closing under 0.7835…but that is all we have done!
In fact, the 0.7835 level is now 0.7883 as the market did indeed make new highs and compromised 0.7835. Prices went below 0.7800 and tested the support of the Middle Tine of the bullish 2015 Andrews Pitchfork (currently 0.7772) but failed to maintain the drop by a) not even testing the Medium MA (currently 0.7704) nor the Mar low at 0.7650 or b) failing to close consecutively below the Middle Tine. Prices have therefore risen since the middle of last week and it has given me an opportunity to draw some new bullish Andrews & Schiff Pitchforks on the Mar – Apr action.
The key move for the recent rebound upwards would seem the previously mentioned 50% Fib at 0.7883…and I agree it is important but in the ascending action I would say the new Apr 50% Fib at 0.7923 is key. Consecutive closes over this and we are back where we were last month at this time. Resistance is currently at 0.7877 – 0.7883, 0.7923, 0.7938 – 0.7947(dynamic) & 0.7968.
Support is at 0.7828, 0.7784, 0.7771(key& dynamic), 0.07737 – 0.7729, 0.7704(dynamic) & 0.7650. Given the peaking action during the month & despite the bullish turnaround of the last few days (…it is after all only a few days…) I feel obliged to tone down to a milder bullish sentiment on the bullet point above…with a question mark.
EURGBP trend up? – Eddie speaks out in Geneva
Last month I pointed out two things of significance. The first was the approach to the highly important 1.1495 high from Oct 2015 which was approximately coincident with the target marked by an ‘X’ on the Daily Chart above of the Mar – Apr Bullish Halfway Hesitation.
The second was the 2016 Bullish Andrews Pitchfork and specifically the Centre Tine (currently 1.1590) which at the time seemed to act as a possible angle of attack of the market higher…or at least a cap on a sort of closing basis to the then move higher.
During Apr I noted at a Platts Kingsman Sugar Conference in Geneva (where I did a presentation) how there was a crossover of the Centre Tine of the AP, the significant high plus the Upper Tine of a Schiff Pitchfork I had previously drawn. All these would happen between the 18th – 20th of Apr (marked with a large circle above) and with a bias for the 18th.
I suggested that during this period there could be higher volatility or a significant change/start of direction…or both. As it turned out the 20th saw a Key Reversal Down, but that was not all. The 21st saw another KR Down…a very, very rare Double Enveloping KRs Down. I did not recall ever seeing any such before.
The question was what did it mean…initially I though it meant lower (obviously) but I reserved some judgement as I had never to my recollection seen anything quite like this in FX. Needless to say, the next day we went down but halted just under the previous Apr low and just ahead of the Middle Tine of the SP…and the 61.8% Fib of the Mar – Apr move at 1.1218.
Prices then formed a Bullish Piercing Line Pattern and motored back up to again to test the 2016 high. In the meantime we’d also formed a Golden Cross of the Medium MA up over the Long MA. Since then I’ve had the opportunity because of the action to draw a new AP & SP over the Mar – Apr action and would bring your attention to the two smaller circles on the 3rd – 5th and 12th – 13th where possible significant market changes may occur. Support is currently at 1.1439(dynamic), 1.1394 – 1.1386, 1.1363, 1.1263 & 1.1222 – 1.1213. Resistance is at 1.1464, 1.1495, 1.1503 – 1.1513, 1.1637 & 1.1711.
Given all that has happened, it would seem appropriate to tone down the with a question mark the bullishness on the bullet point above.
EURUSD – trend up?
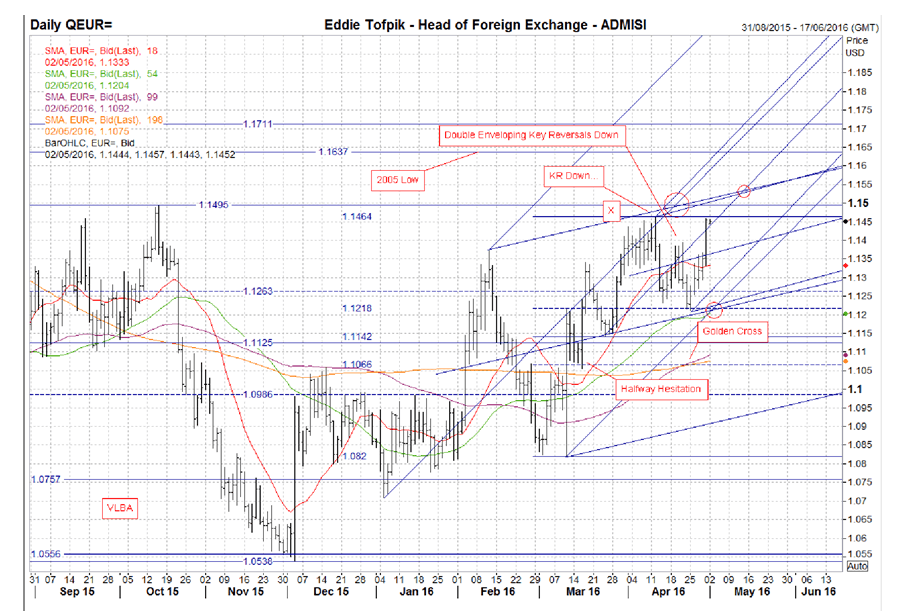
Last month I spoke about a number of things relating to this pair. 1) ‘The higher target ‘Y’ is a fast and dirty potential target for the VLBA (Very Long Basing Action) action previously mentioned. I stress, I have my doubts on the VLBA but feel obliged to point it out…however much it is an approximation.’ .
Despite my concerns, I am pleased to say that the market reached the target for the VLBA at about 0.7825. 2) ‘…a possible Bullish Bow Tie Pattern of MAs. Now the ‘rules’ are that within 15 – 20 business days of the crossover the market ought to move in the direction of the expanding Bow Tie.
Add to this the difficulty of actually finding a day for the mutual crossover of these MAs and you can see there are issues.
So – taking the approximate midpoint…roughly the 28th of March, and then between the 18th – 25th of Apr would see the move higher.’
An interesting one this is – on the 18th we had a huge Key Reversal Up, the second within three days and so the expectation was for higher still. The market duly delivered (making point ‘Y’ in the process) but then KRd Down with another huge KR Down only a few days later, last Wednesday…but since then nothing?
All of the potential from last month has been fulfilled and now it seems the market doesn’t quite know where to go? We’ve had within the last month five of the twenty sessions as KRs, three down/two up and we’re only 66 tics lower. The volatility is disguising some uncertainty in the market that lagging indicators such as MAs would not be able to pick up.
Hence, I’m putting a question mark on the bullish bullet point above…the least that ought to be done. Support 0.7588, 0.7545, 0.7538(dynamic), key at 0.7488 – 0.7492 and then 0.7448, 0.7413 & then a key band 0.7334 – 0.7325. Resistance is at 0.7621, 0.7650, 0.7661(key & dynamic), 0.7690 – 0.7702, 0.7738, 0.7771, 0.7835 & 0.7851.
USDJPY – Trend down?
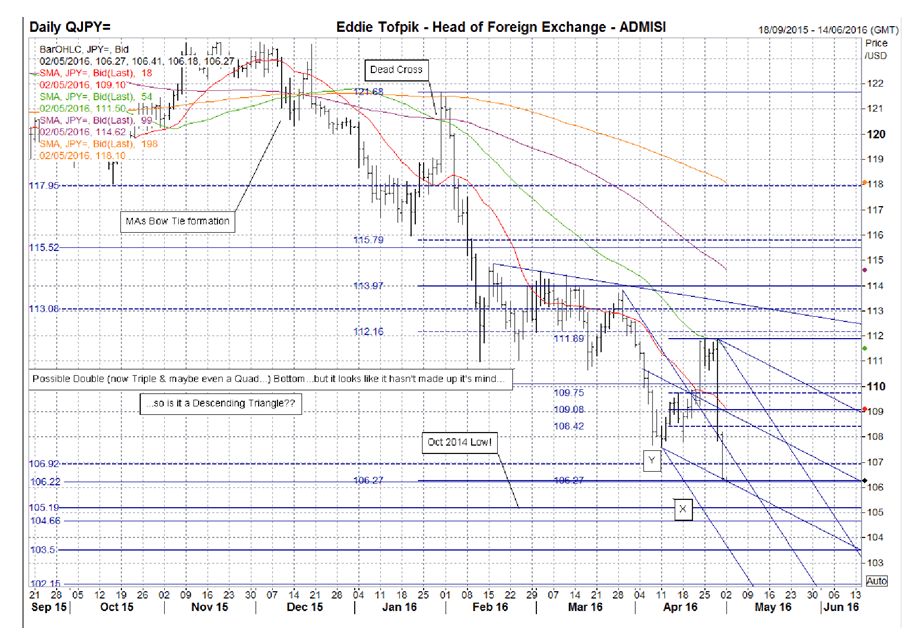
Last month I wrote extensively on the Descending Triangle Pattern that had formed over March.
I now point out the possible Elephant-In-The-Room, the possible Descending Triangle formed from the whole of the Mar action. In this case the ‘Y’ on the Daily Chart above marks a potential target for such a pattern (about 3.1650).’. The DT has evolved in to a Descending Wedge.
Now I am not very keen on DWs as it is difficult to suggest which direction a break could go into…they are unreliable other than to gauge the size of the move…but also this DW is in the wrong place, it should be earlier…but I’ll reserve judgement just yet – I’ll keep point ‘Y’ just in case.
I also wrote about the merits of the Bearish Sep 2015 – Jan 2016 Andrews Pitchfork. This is still there and the Middle Tine seems to be showing the angle of attack of the market lower at the moment. Finally I wrote about a seeming congregation ‘…between the 22nd of Mar & the 15th of Apr with possibly important dates within on the 4th & 8th of Apr.’
Though seemingly unimportant, I would draw your attention to the 7th which was not only the high in Apr but was also the second point in the Downtrend forming the DW and I think the point at which the market chose not to go for a DT but for a DW. Pattern. I had one other area potentially marked out – the 20th of Apr – but this turned out to be nothing…though the nearby 22nd was significant.
So where are we now? Well it would not be unusual to travel a little further lower down the DT with support currently at 3.3971 & resistance 3.5794. 3.4715 is currently the Centre Tine of the AP and falls by about 50 tics a day…watch this if you agree on the idea of the angle of attack.
Further support is at 3.4219, 3.4034, 3.3103, 3.2327 & 3.1643. Resistance is as well as the previously mentioned numbers at 3.4567, 3.4923, 3.5222, 3.5648, 3.5896, 3.5999, 3.6180 & key plus dynamic at 3.6392. With three out of four MAs turned down I think it appropriate to push the bullet point above into neutral.