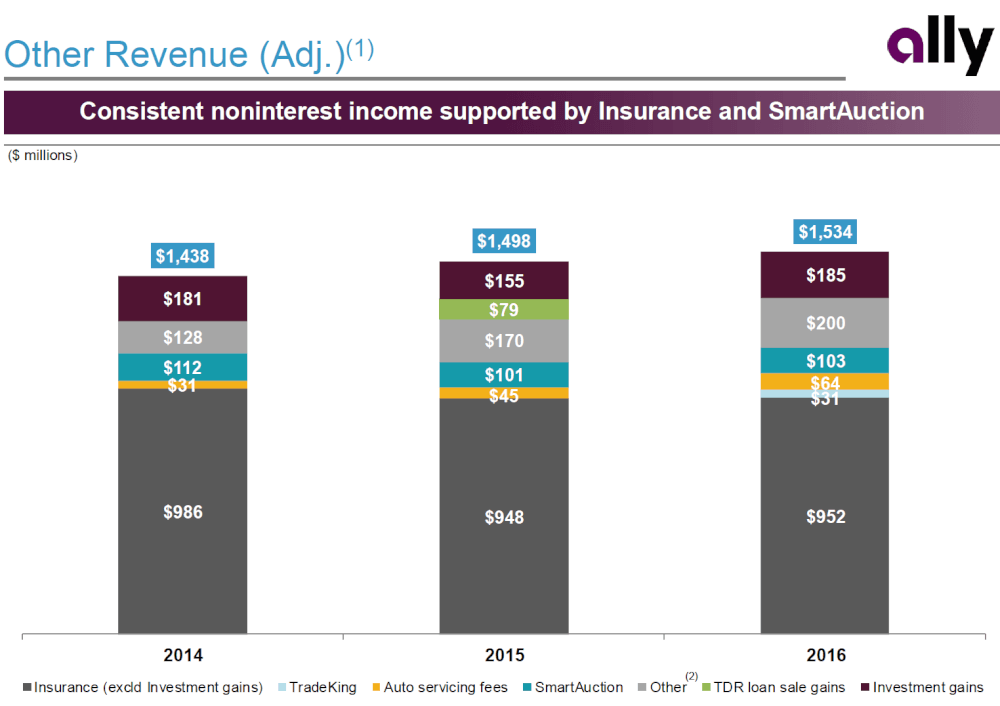
TradeKing contributes $31m to FY2016 revenues of Ally Financial
Ally said other revenue edged higher year on year due primarily to higher investment gains in the current quarter and the addition of TradeKing revenue.

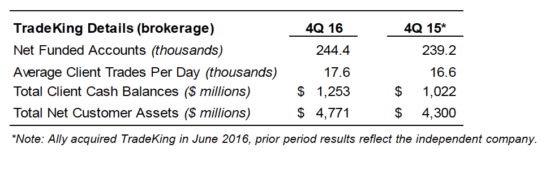
US financial services provider Ally Financial Inc (NYSE:ALLY) has earlier today posted its financial report for the final quarter and full year 2016, with the results including the impact from the acquisition of TradeKing Group, Inc., a digital wealth management company with an online broker/dealer, digital portfolio management platform, and educational content and social collaboration channels.
The deal, which was first announced in April 2016, was closed in June last year. Ally said back then that it is purchasing TradeKing for approximately $275 million (subject to certain purchase price adjustments), representing about $250 million in premium to the acquired net assets. At the moment of acquisition, TradeKing had approximately 260,000 brokerage funded accounts and 20,000 daily average revenue trades (DARTs). It also had around $4.5 billion in client assets, including some $1.1 billion of cash and sweep deposits.
Today, Ally listed the deal with TradeKing amid the 2016 highlights. Although non-interest expenses edged higher in annual terms mainly due to TradeKing integration and operations, other revenue climbed year on year due primarily to higher investment gains in the current quarter and addition of TradeKing revenue.
The report shows that TradeKing contributed $31 million to Ally’s “other revenues” in 2016. TradeKing’s results are, of course, added to Ally’s after June 1, 2016.
- FY 2016
Looking at the overall fortunes of Ally Financial in 2016, we see that the net income amounted to $1.1 billion, down from $1.3 billion in the prior year. The comparison is affected by the $392 million boost the 2015 net income figure received from the discontinuance of certain operations and the sale of Ally’s former joint venture in China, in particular.
Net financing revenue improved to $3.9 billion, up $188 million from the preceding year. Other revenue increased $388 million in 2016 over 2015 levels.
Adjusted earnings per share rose 8% in 2016 to $2.16.
- Q4 2016
Ally reported net income of $248 million for the final three months of 2016, compared to $263 million in the same quarter in 2015, as higher total revenues were more than offset by higher provision and non-interest expense.
Other revenue rose $36 million year over year, due to auto finance-related fee income, revenue from online brokerage and improved results in the corporate finance business.
Provision expenses increased $27 million, compared to the same quarter in 2015, to $267 million.
Non-interest expenses climbed $53 million year over year reflecting to continued growth in auto lending and deposits and new product expansion initiatives, including online brokerage.