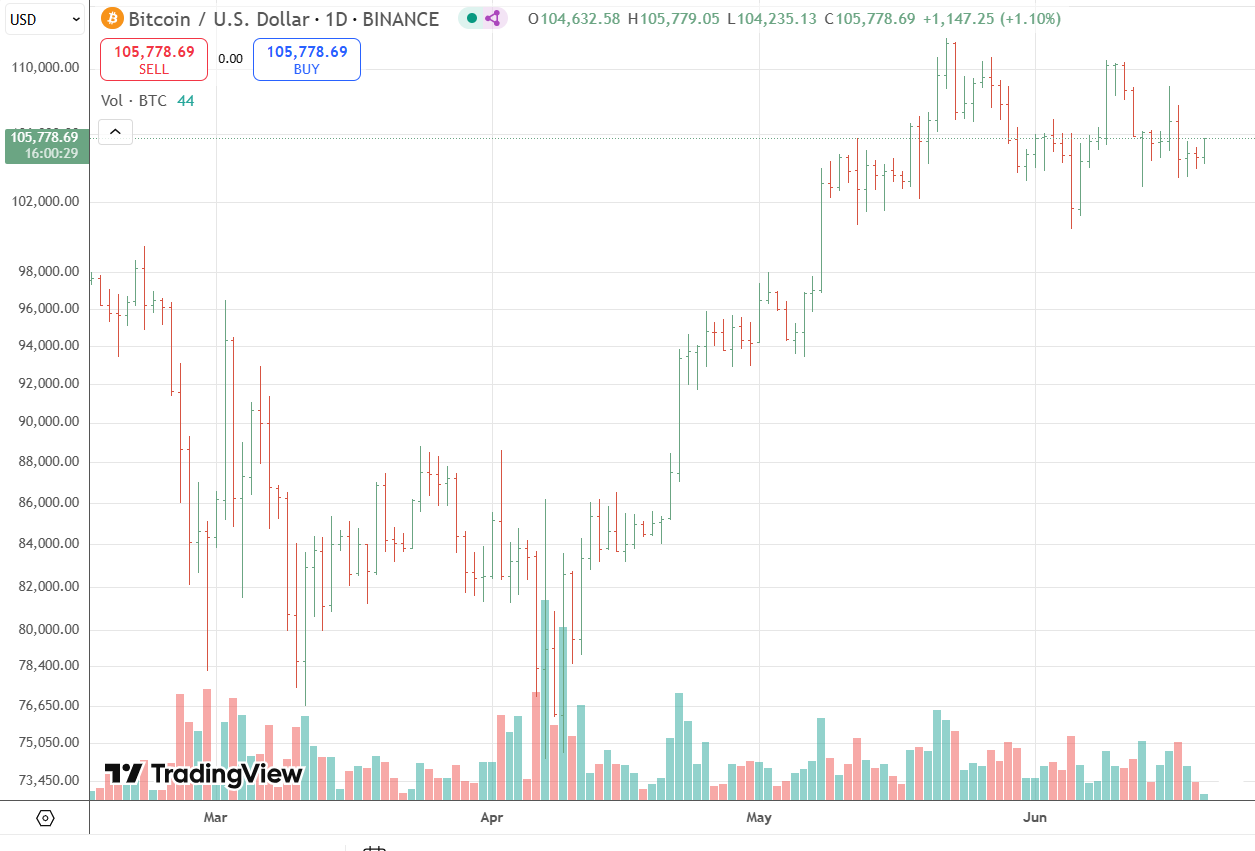
Bitcoin (BTC) continues to hover around the $105,500 mark, showing minimal intraday movement as it consolidates within a narrow range between $104,000 and $105,600. Despite ongoing geopolitical tensions and market caution ahead of U.S. Federal Reserve signals, the flagship cryptocurrency remains stable—buoyed by a weak U.S. dollar and sustained institutional interest.
ETF inflows and on-chain accumulation from corporate treasuries have kept bullish sentiment alive, while the broader crypto market remains in wait-and-see mode.
Bitcoin’s chart structure suggests it is on the cusp of a decisive move. After forming a bullish flag pattern, BTC is now testing the upper resistance band around $110,000–$112,000. A breakout from this zone on high volume could validate the pattern and set the stage for a move toward the $137,000 target—derived from the flag’s measured move.
Short-term support is holding at $107,000, aligned with previous highs from late 2024. Below that, $100,000 remains a psychological and technical anchor. A break beneath this level could drag BTC toward deeper support around $90,000, coinciding with a long-term Fibonacci retracement zone.
On the daily chart, Bitcoin remains above its major moving averages. A recent golden cross—where the 50-day moving average (MA50) crosses above the 200-day (MA200)—adds to the bullish outlook. RSI levels on the weekly timeframe suggest BTC still has room to climb before becoming overbought.
However, short-term indicators (15-minute timeframe) are mixed, with slight bearish pressure emerging under $104,700. Immediate support lies near $103,800, with the next key level at $102,700.

Ethereum (ETH) is currently trading near $2,550, locked in a consolidation range with intraday levels between $2,488 and $2,547. The price action reflects growing tension in the market, with ETH positioned just beneath a multi-month resistance cluster at $2,675–$2,800. Traders and institutions alike are now watching for a catalyst that could send Ethereum surging past this barrier or tumbling into deeper support.
On the macro front, Ethereum continues to benefit from broader institutional interest, including rising ETH ETF inflows and increasing staking rates. These trends reduce liquid supply and add long-term bullish pressure to the asset.
Ethereum’s price structure on higher timeframes suggests a classic consolidation before a breakout. The current pattern resembles a cup-and-handle formation—traditionally a bullish signal—if confirmed by a close above the $2,800 level. The measured move from this formation points to potential targets in the $3,300–$4,100 range, with a possible extension toward $4,500 under ideal conditions.
Meanwhile, support remains firm at $2,490–$2,500. This band has been tested multiple times in recent weeks, offering a reliable floor. A daily close below this zone, however, could lead to a sharp pullback toward $2,350–$2,450—a well-defined on-chain support region backed by historical buying interest.