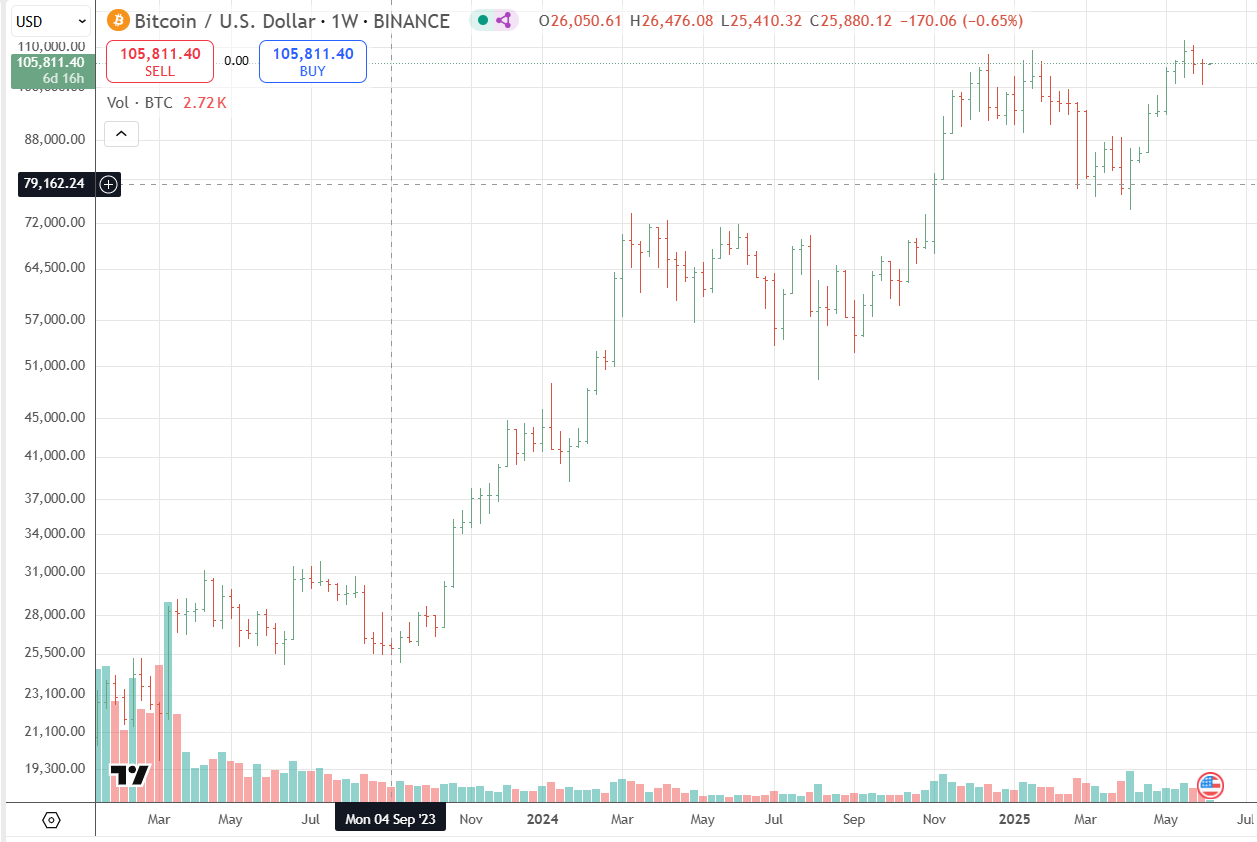
Bitcoin (BTC) is currently trading at $105,706, reflecting a minor intraday dip of 0.2%. The day’s range has seen BTC touch a high of $106,368 and a low of $105,110, suggesting ongoing consolidation within a narrow channel.
Support is forming in the $105,400–$105,700 zone, while resistance near $106,600–$107,000 remains a key level to watch. The market structure points to potential volatility should these boundaries be breached.
The formation of a Golden Cross in early June—where the 50-day moving average surpassed the 200-day—has historically been followed by substantial bullish momentum. Currently, BTC is trading within a symmetrical triangle, with a breakout to either side imminent.
Notably, nearly $15 billion in short positions could be liquidated on a +10% move upward, indicating a possible short squeeze toward the $117,000–$125,000 region. On the downside, a fall to $97,100—the Short-Term Holder (STH) cost basis—may offer robust support.
Other indicators include:
- RSI divergence, reminiscent of 2021, warns of potential correction.
- On-chain metrics like the RHODL ratio remain stable, showing long-term holders are not distributing.
Institutional and corporate adoption of Bitcoin continues to climb. Firms like MicroStrategy and GameStop have added BTC to their treasuries, with over 80 public companies now holding nearly 3.4% of total supply. Projections suggest that corporate allocations alone could contribute $330 billion in demand by 2029.
The U.S. government’s de facto strategic Bitcoin reserve—estimated at nearly 200,000 BTC—adds a further layer of legitimacy. Meanwhile, nearly 40% of global single-family offices are now allocating to crypto, often between 2% and 5% of total portfolios.
Geopolitical and economic catalysts, including U.S.–China trade tensions and upcoming inflation data, may inject short-term volatility but are unlikely to derail the broader institutional accumulation trend.
The current consolidation phase suggests BTC is coiling for a significant move. Key levels to monitor:
- Support: $105,400 → $100,000 → $97,100
- Resistance: $106,600–$107,000 → potential breakout toward $115,000–$125,000
Bitcoin’s near-term path remains tightly bound within a $1,000 range, but technical, on-chain, and macro signals align in favor of a bullish resolution. As traders eye a breakout, institutional confidence continues to provide a strong foundation for long-term price growth.
For short-term traders, $106,600 is the pivot level. Swing traders may look to accumulate on dips toward $100K, while long-term investors remain well-positioned for potential price expansion toward the $150K mark by year-end.

Ethereum (ETH) is trading at $2,489.58 marking a modest 1.1% daily decline. The intraday price range between $2,482 and $2,537 reflects tightening market conditions and trader hesitation.
Support has solidified between $2,460 and $2,485, while resistance is visible at the $2,532–$2,540 level—aligned with the 50-day exponential moving average and recent swing highs. A breakout above this zone could set the stage for a move to $2,700 or higher.
ETH’s price structure remains within a narrow consolidation channel, with low volatility and neutral momentum indicators. Bollinger Bands are contracting, suggesting an imminent directional move, while the Relative Strength Index (RSI) hovers in neutral territory (55–60).
Meanwhile, the Moving Average Convergence Divergence (MACD) is leaning bearish on the short-term chart. A recent $870 million transfer of 350,000 ETH to exchanges has sparked short-term concern, though broader on-chain trends suggest long-term holder confidence remains intact.
Institutional participation continues to rise, with BlackRock’s Ethereum ETF (ETHA) posting $492 million in net inflows last week. Simultaneously, staked ETH has climbed to over 32.8 million—more than 27% of the circulating supply—further reducing market float.
Ethereum’s recent “Shanghai” and “Pectra” upgrades have bolstered network utility and staking flexibility. While ETH has lagged behind Bitcoin in 2025, analysts cite these protocol enhancements as foundational for future growth.
Traders are closely monitoring the $2,540–$2,550 resistance band for signs of a breakout. If breached, ETH could rally to $2,700–$2,800. Conversely, a failure to reclaim $2,540 could see the asset drift sideways or retest support near $2,435.
Macro risk-off events or sustained exchange selling could push ETH lower toward the $2,300–$2,344 zone, though underlying fundamentals remain constructive.
Ethereum’s current price action reflects market indecision, but fundamental indicators—rising institutional adoption, increasing staking rates, and successful network upgrades—suggest a bullish undercurrent. While short-term direction remains uncertain, ETH’s long-term setup continues to strengthen.
For traders and investors alike, the $2,460–$2,540 range offers a defined battleground, with clear upside potential should resistance break convincingly in the sessions ahead.