Newest version of NinjaTrader enhances work with charts
The latest version of NinjaTrader comes equipped with new indicators and chart styles.

NinjaTrader, a specialist in trade simulation, advanced charting, market analytics and backtesting, has just released the latest version of the platform, with the focus apparently being on chart work enhancements.
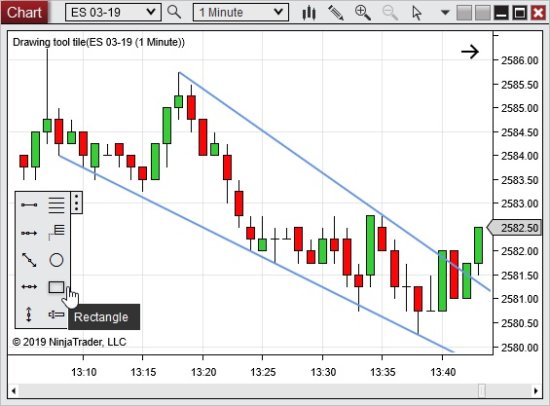
The new version of NinjaTrader (8.0.17.0) adds Drawing tool tile indicator. It enables users to have a floating tile in the chart that can be customized to quickly access the most commonly used drawing tools.
Traders will probably notice the addition of a “Go to” option to the chart scroll-bar right click menu. This feature allows to quickly move to the specified time on a chart.
The new version of the platform also allows traders to use a Hollow Candlestick Chart style. Hollow candlesticks can color the outline/wicks the up/down bar colors. This style has a separate color for doji bars, all with a transparent center.
The latest version of NinjaTrader also adds a ‘Path’ drawing tool. It enables traders to plot multiple connecting lines without it needing to be a shape.
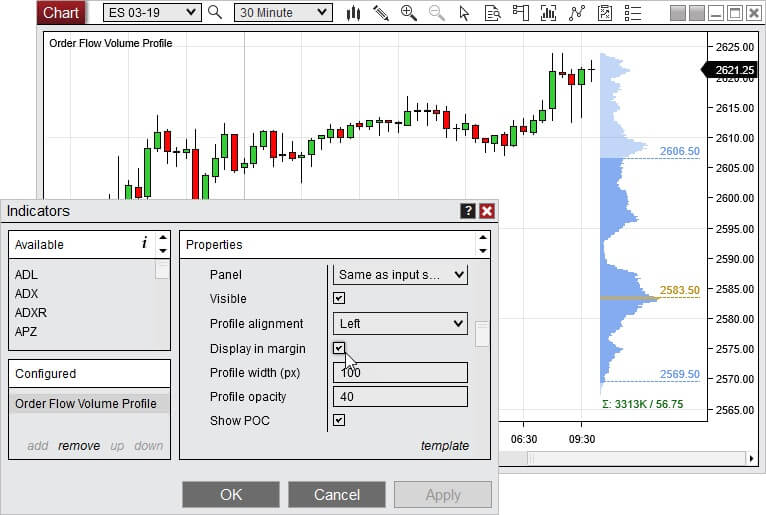
Finally, let’s note that Order Flow Volume Profile in composite mode now has “Display in margin” option. Thanks to the Display in margin option, traders will be able to plot the profile without overlapping the bars when using composite mode.
Let’s recall that the preceding version of the platform added more features to “Order Flow +” items. Thus, for instance, the Order Flow Depth Map got equipped with a real-time display that graphs the current market depth for an easy visualization of where the highest resting volume is.
The NinjaTrader Order Flow + studies are powerful tools to assist in order flow, volume and market depth analysis. They are included for all NinjaTrader lifetime license users. The lineup of such tools includes items like Order Flow Cumulative Delta – an indicator that accumulates the volume of orders filled at bid and ask prices or up and down ticks throughout the session or bar and compares them to determine buy/sell pressure, as well as Order Flow VWAP (Volume Weighted Average Price), which reflects the total of the dollars traded for every transaction (price multiplied by number of shares traded) and then divided by the total shares traded for the day.