
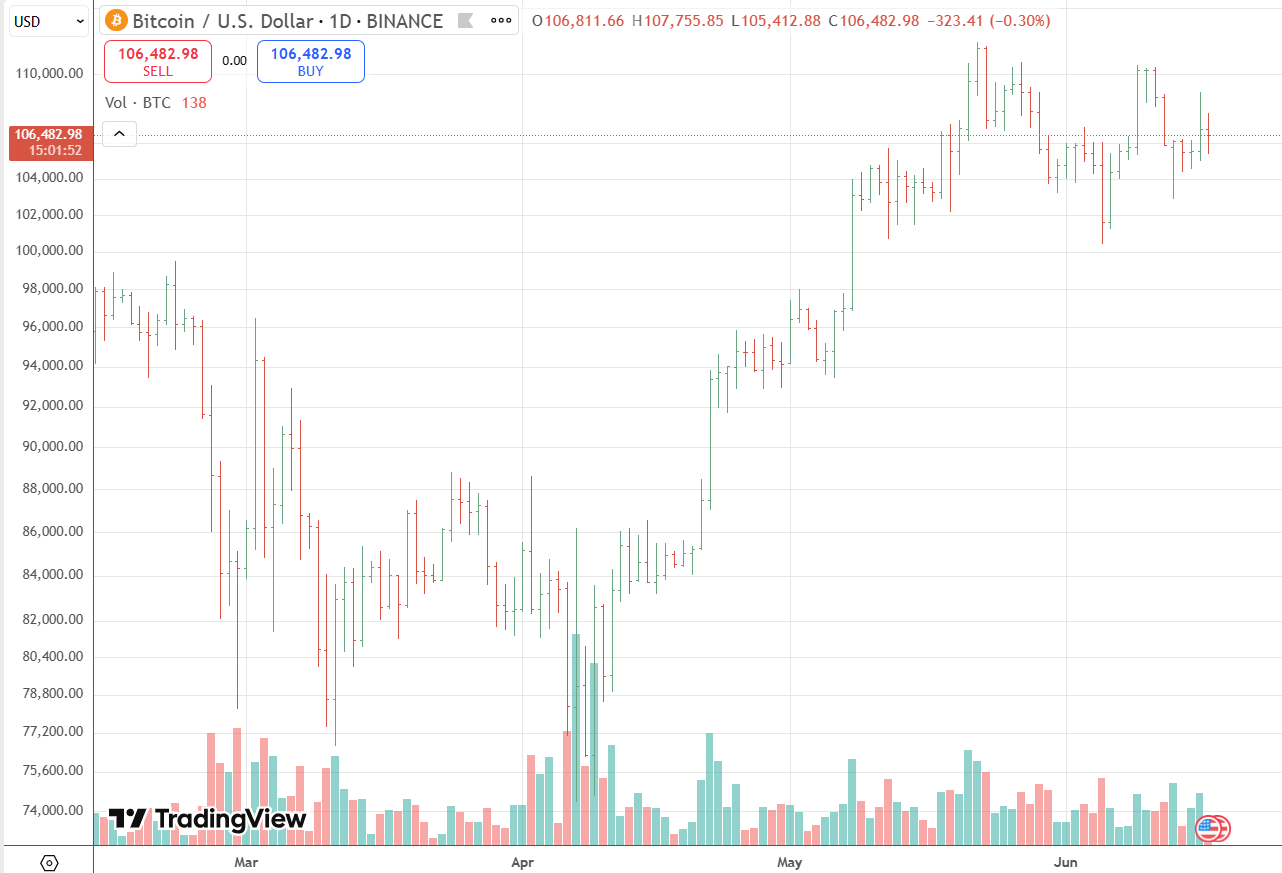
Bitcoin (BTC) is trading around $106,638 after a mild 0.45% intraday decline. Price action remains range-bound between $106,366 and $108,801, with bulls defending critical short-term support levels.
On the 4-hour chart, BTC is forming a tightening wedge, with declining volume hinting at an impending breakout. The $109,000 resistance remains the key upside barrier. A decisive break above could open the path toward $112,000, with secondary targets at $120,000 if momentum builds.
Momentum indicators are mixed:
- The MACD recently printed a mild bearish crossover, indicating short-term consolidation.
- The RSI remains neutral near 52, avoiding overbought conditions and leaving room for upside expansion.
- Support remains firm at $105,000; a close below risks a pullback toward $100,000 psychological support.
On-chain data remains strongly bullish. Glassnode’s accumulation score has risen to 0.88, signaling sustained whale accumulation. Institutional flows into Bitcoin ETFs continue to climb, with assets under management now surpassing $132 billion.
Macro conditions remain favorable, with easing inflation and a softer dollar supporting risk assets. While short-term traders watch $105K–$109K closely, the broader trend remains intact for higher highs.
If BTC clears $112K on volume, momentum could accelerate toward year-end targets of $120K–$150K. Failure to hold $105K, however, could shift sentiment bearish in the near term.

ETH technicals point to an imminent breakout as price action compresses in a tightening range.
Ethereum (ETH) is trading around $2,573 following a modest 2% intraday decline. The asset remains range-bound between $2,536 and $2,672, as traders closely monitor a developing wedge formation suggesting an upcoming breakout.
On the 4-hour chart, ETH is compressing within a descending wedge with declining volume — often a precursor to significant price movement. Immediate resistance lies at $2,589 to $2,600, where the 7-EMA and 20-EMA converge. A breakout above this range may open upside targets at $2,620 and $2,648, with $2,745 as a key next level if momentum accelerates.
Momentum indicators are neutral to slightly bearish. The Relative Strength Index (RSI) sits near 47 on the 4-hour timeframe, indicating ample room for either direction. The MACD histogram is flattening below zero, suggesting fading bearish momentum but lacking a strong bullish cross at present.
On the downside, initial support is holding at $2,553, followed by a stronger support zone between $2,500 and $2,535. Should ETH lose the $2,500 level, traders may see a pullback toward the $2,440 range.
On-chain data suggests accumulation continues quietly, with institutional flows into ETH remaining steady. Additionally, a broader bull flag pattern on the daily chart points to a potential breakout level near $2,837, with bullish projections as high as $3,300–$3,700 if confirmed.
For now, traders are watching $2,600 as the key inflection point. A decisive breakout on volume could signal the next leg higher, while failure to hold key support zones may expose Ethereum to further downside.