IG adds deal position preview functionality to web trading platform
When filling in a deal ticket, new visual features will appear on the graph.

Online trading major IG Group Holdings plc (LON:IGG) keeps introducing new functionalities to its web trading platform. Shortly after enabling traders to add % Range to watchlists, the broker responds to client feedback via the introduction of the deal position preview functionality to the web trading platform.
The feature is automatically enabled on the new dealing platform. To disable it, traders have to right click on the graph and select Position Preview from the “show” dropdown.
When filling in a deal ticket, new visual features will appear on the graph. When the direction (buy or sell) is selected, a shaded area will appear above (if buying) or below (if selling) the current price. This area will display the price the market needs to touch to profit from the transaction. The shaded area will not start from the price the trader executed the trade at, as the market needs to move in trader’s favour by the size of the spread before being at break-even.
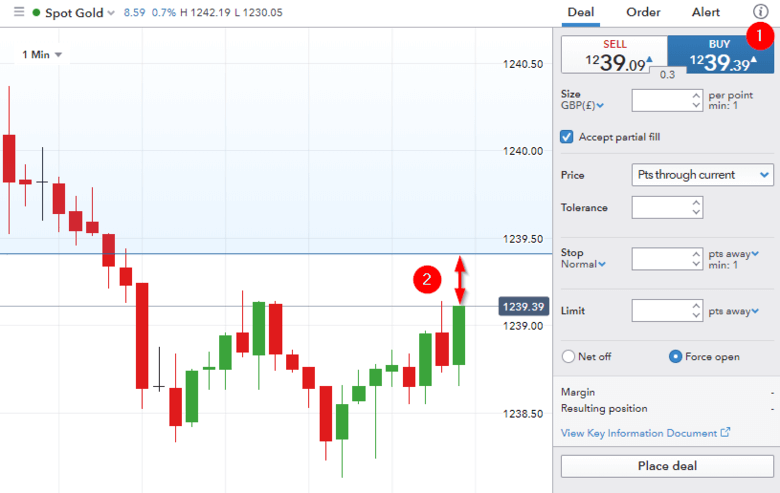
- In the example the Buy price is 1239.39
- The blue ‘profit level’ is displayed at the executed deal price +/- the spread
The broker notes that the price level on the chart can either be the bid (buy), mid or ask (sell). In order for the ‘profit level’ to work properly, one will have to have the correct price level displayed on the chart. Traders can select this by right clicking on the chart and selecting bid (if they are buying) or ask (if they are selling).
If a stop is added, a new shaded area will appear in the opposite direction. This will give a visual representation of the range of movement one’s position has before the stop is triggered and one’s position is closed out.
By adding a limit, a risk/reward ratio will appear. This will compare the expected return of the position with the amount of risk undertaken to capture such returns via the ‘Risk/reward ratio’.