IG adds new feature to charts
Traders can now quickly and easily see the percentage movement on any given period for any market.

Electronic trading major IG Group Holdings plc (LON:IGG) has just announced some enhancements to the charts on its trading platform.
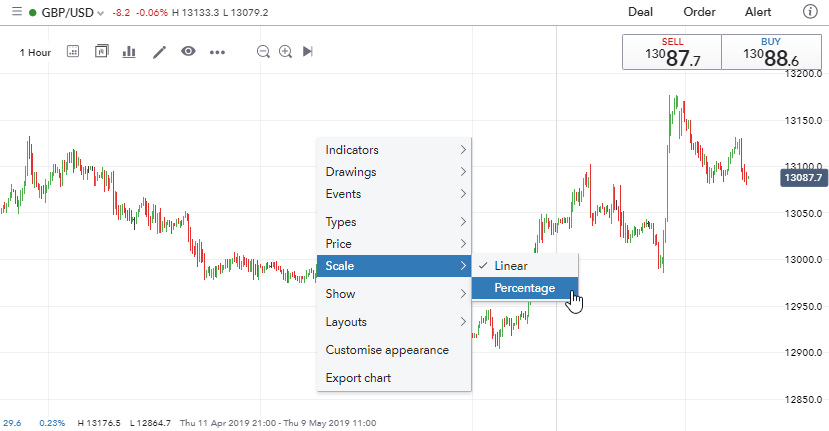
Based on client feedback, IG’s charting team has just delivered a new feature on mobile and desktop. Traders can now quickly and easily see the percentage movement on any given period for any market. This is accessible from the ‘Other Options’ drop down, or by right clicking on the chart, and selecting ‘Percentage’ from the ‘Scale’ option.
The percentage scale will then be reflected on the Y axis for the 1st candle (close) visible on any chart to the last. In other words, the percentage change for the visible candles on the chart.
As traders zoom in or out, the scale will adjust automatically.
In April this year, IG enabled its clients to use a ‘drag and drop’ functionality to set the stops and limits on charts before a trader has placed a trade. This is available for anyone who has ‘Position Preview’ enabled.
The company has also added a further row to HLOC data to share % Change. Bringing up HLOC data requires a right click, followed by Show > HLOC Data. Once selected, hovering over the chart candlesticks should bring up the required information.
In February this year, in an effort to make its trading platform easier to navigate, the brokerage made the ‘show’ button easier to find by adding the toggle to the top of the charts. By clicking this button, traders will be able to customize the information that appears on their charts. These functionalities were previously available by right clicking on the graph, however due to significant and continued client use they are now only one click away.