IG adds new “Go To” feature to web platform charts
The feature allows users to search for a specific date (and time) on a chart in a few simple clicks.

Electronic trading major IG Group Holdings plc (LON:IGG) continues to bolster the capabilities of its new web trading platform. The latest set of new features focuses on better work with charts, with the improvements likely to appeal to traders who are keen of precision and would not like to drown in data.
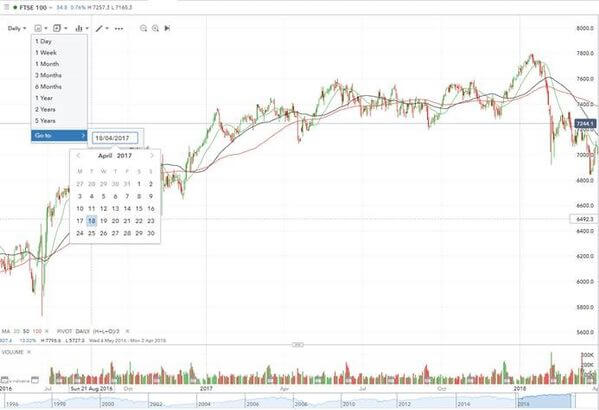
A feature which has been requested a number of times over the last few months is the ability to hone in on a specific date on a chart. IG has announced that the charts team just released a new “Go to” feature on the new web trading platform.
This feature will allow users to search for a specific date (and time) on a chart in a few simple clicks. The charts will then automatically centre on the searched date/time requested by the user.
Traders can access this functionality by clicking on the calendar icon shown in the top level menu and then by selecting “Go to” where a date can be specified. A date and time can be searched for if you are using a time interval smaller than a day (for instance, 1 hr).
Another tweak allows improved customisation on Pivot Points. This feature was launched late last week on the new web trading platform and mobile. Using the Pivot Point Indicator can now decide to show:
- either the data for the last day/week/month only (default option);
- or to show the historical data as well.
Traders can change this behaviour by clicking on “Pivot” which opens the Pivot points options.
The latest upgrades are implemented about a month after another set of enhancements to the platform allowing better customization of charts and easier access to HLOC (High, Low, Open, Close) data.
Those enhancements were introduced after the company had received a lot of suggestions to have the HLOC data display by default on the charts instead of having to right click and go to Show->HLOC Data. As a result, by opening a chart traders should now see the HLOC data display as a default. They can still hide this data by right clicking->Show->HLOC Data.
Another new tweak is the feature that enables traders to hide or change the colour of the background grid on the charts. IG has added this feature to increase traders’ ability to customize their charts, so they are able to completely hide the grid or change the colour of the grid.
This feature is available from the “Customise appearance” entry where a checkbox “show grid” is now shown. The colour picker will give access to the colour customization.