IG boosts traders’ ability to customize charts in new web trading platform
HLOC data is now shown by default and traders can hide or change the colour of the background grid on the charts.

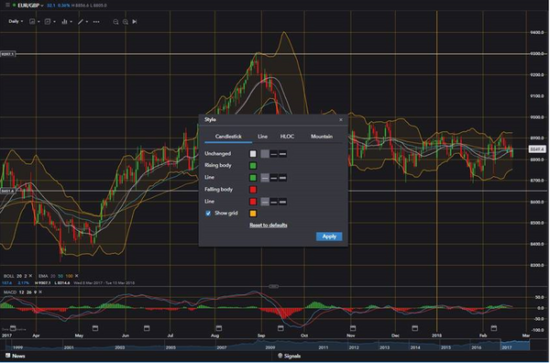
Electronic trading major IG Group Holdings plc (LON:IGG) has made some enhancements to its new web trading platform, allowing better customization of charts and easier access to HLOC (High, Low, Open, Close) data.
The company has received a lot of suggestions to have the HLOC data display by default on the charts instead of having to right click and go to Show->HLOC Data. In response to the demand, IG has implemented this change. As a result, by opening a chart traders should now see the HLOC data display as a default. They can still hide this data by right clicking->Show->HLOC Data.
Another new tweak is the feature that enables traders to hide or change the colour of the background grid on the charts. IG has now added this feature to increase traders’ ability to customize their charts, you will now be able to completely hide the grid or change the colour of the grid.
This feature is available from the “Customise appearance” entry where a checkbox “show grid” is now shown. The colour picker will give access to the colour customization.
This new feature is available to users of the new web trading platform as well as to users of IG’s mobile application.
Last month, IG added a new feature to the platform enabling traders to pre-set a timeframe. This means that traders can select to view data for 1day, 1 week, 1 month etc up to a period of 5 years. Once they have selected the timeframe of their choice, the chart will reload and snap to the selected period.
In October last year, IG introduced ‘Indicator’ alerts to the platform. These can be added via the ‘Alerts’ tab on a chart. The move was in line with the rollout of other new features for technical analysis fans. For example, in August last year, the web trading platform gave traders the opportunity to make use of up to eight Moving Averages.