IG adds working order preview to charts
Traders can now see their working order shaping up on the charts as they start creating orders from the ticket.

Online trading major IG Group continues to enhance the functionalities of its platforms, especially with regards to charts.
In a similar manner to the position preview feature, traders can now see their working order shaping up on the charts as they start creating orders from the ticket.
To make use of the new functionality, simply input your order direction, size and level and you will be able to see a preview on the chart. You can then decide to drag you Stop and/or Limit from the chart to define their absolute level and see the related Risk/Reward Ratio. Once you are satisfied with this just place your order from the ticket.
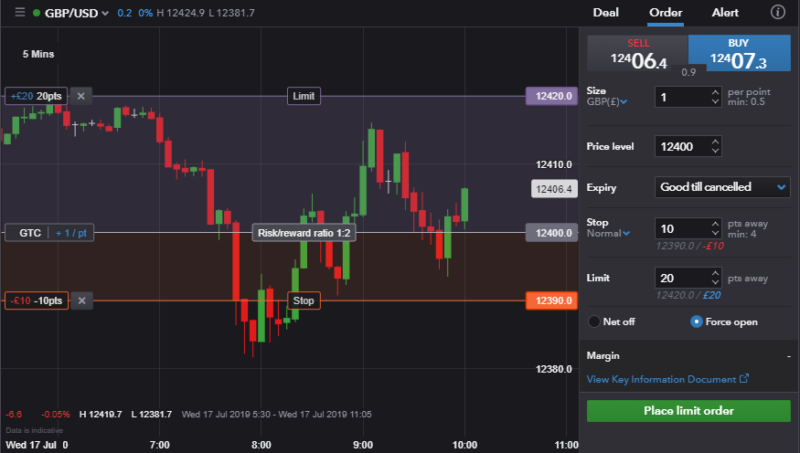
Traders will need to make sure ‘position preview’ is on – they can toggle this by right clicking on the charts and navigating to ‘show’.
IG has recently made switching between different intervals on the IG desktop charts easier. Traders who would like to change intervals (from 1 minute candlesticks to 5 or 10 minute candles, or to hours, days or months) can make use of keyboard shortcuts. Whilst on a chart a trader can type any number from 1 to 5 on the keyboard to bring up a small ‘interval’ dialogue box. Then the trader needs to confirm the choice, and hit enter. For example:
- 1 minute intervals: type 1 then enter
- 5 minute intervals: type 5 then enter
- 1 hour intervals: type 1 h then enter
- 2 hour intervals: type 2 h then enter
- 1 week intervals: type 1 w then enter
Also, one can now place the cursor/crosshair on a future date and see the level and time/date where one is positioned. Whilst this is a very minor update which could be seen as a trivial feature, it can become quite handy if one is looking at a trend and want to know exact levels and the time they will be reached. Simply position the cursor in the future and you’ll see the corresponding information straight away.