IG enables traders to customize Stochastic and KDJ indicators on charts
On the back of recent client feedback, IG has enabled traders to customize the Stochastic and KDJ indicator levels on charts.

Online trading major IG Group Holdings plc (LON:IGG) has introduced more enhancements to its platform – fans of technical analysis are most likely to appreciate these.
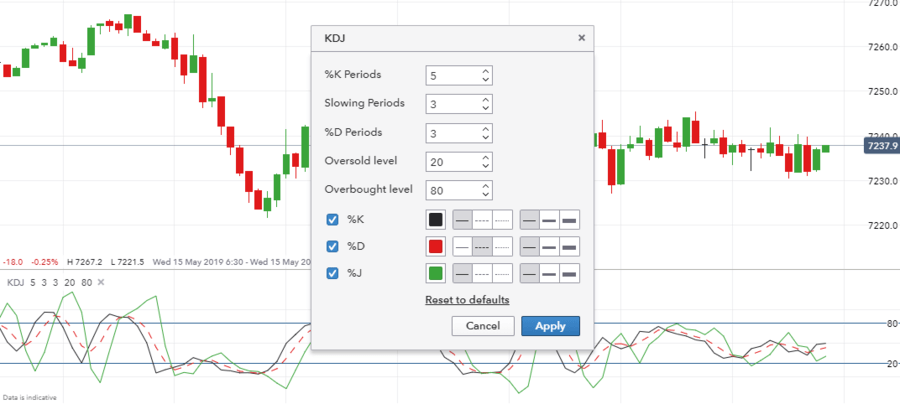
On the back of recent client feedback, the company has enabled traders to customize the Stochastic and KDJ indicator levels on IG charts. Let’s recall that the KDJ indicator is derived from the Slow Stochastic with the only difference being an extra line called the J line. The J line represents the divergence of the %D value from the %K.
Once traders have added either of these indicators (which can be done by right clicking > indicator > stochastic), they simply need to click the label in the bottom left of the chart and the option window will appear. Traders should be able to amend the Overbought and Oversold levels here along with some other variable to customise further.
In another recent charting update, IG provides traders with a brief overview of the indicators on the IG platform and informs them how they can use the indicators to get the most out of their technical analysis. The company plans to roll this out imminently for the various drawing tools it has on the platform as well.
Earlier in May, IG unveiled a new feature traders may use when trading on mobile and desktop. Traders can now quickly and easily see the percentage movement on any given period for any market. This is accessible from the ‘Other Options’ drop down, or by right clicking on the chart, and selecting ‘Percentage’ from the ‘Scale’ option.
In April this year, IG enabled its clients to use a ‘drag and drop’ functionality to set the stops and limits on charts before a trader has placed a trade. This is available for anyone who has ‘Position Preview’ enabled.
The company has also added a further row to HLOC data to share % Change. Bringing up HLOC data requires a right click, followed by Show > HLOC Data. Once selected, hovering over the chart candlesticks should bring up the required information.