IG’s web platform gets more tech analysis enhancements
The web trading platform now offers traders to make use of one of the most popular chart patterns in tech analysis: head and shoulders.

Online trading major IG Group Holdings plc (LON:IGG) keeps bolstering the technical analysis features of its new web trading platform.
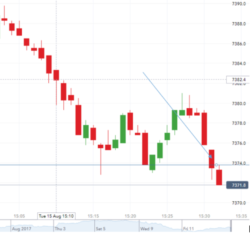 As a part of the latest enhancements, under the drawing section on the chart, traders get an option to place a head and shoulders drawing. This pattern is one of the most popular in tech analysis. It indicates that the price of a given asset is about to move against the current trend.
The IG team has also added a new feature where a small dot will be created on the open position line to display when the position was created. This one is apparently for fans of precision, as well as for those who like to see a position in context.
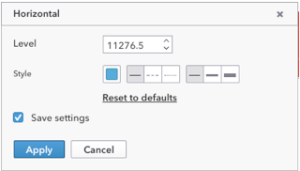 Earlier this month, IG introduced another feature that will most likely be appreciated by fans of tech analysis. Thanks to it, traders are able to save settings on drawings by activating a special checkbox. This checkbox permits the subsequent drawings of that type to have the same settings. For Fibonacci drawings, the checkbox also saves the selected ratios.
IG has also added more keyboard shortcuts to its web platform. These include:
- ESC to dismiss dialogs;
- ESC to deselect positions/orders/drawings;
- ENTER to execute the same action as the apply button on a dialog;
- Up/Down/Left/Right arrows to move drawings (1 pixel at a time).
These add to the list of shortcuts to platform charts introduced in July.
Talking of tech analysis improvements, let’s mention that in May this year, the company responded to client requests by adding Fibonacci extensions to the new platform charts. Traders can access this feature from the drawing tools menu on the new charts.
And last month, the broker added Elliott Waves tool to the new platform charts. It can be found in the drawing menu at the top of the chart, or by right-clicking on a chart. Traders can then select five points on the chart to form the drawing.
Also, some improvements were made to the Fibonacci drawings and Ichimoku indicators on the charts. On Fibonacci drawings, the last click to place the drawing allows traders to select the length of the drawing on the chart (i.e., how far across the chart the levels are visible). On the Ichimoku indicator, traders were allowed to customise which levels are shown.
The next long-awaited step concerning the new platform should be the addition of new trading instruments, with options being widely anticipated by the broker’s clients, as indicated by IG Community forum comments.