Latest version of NinjaTrader platform adds more features to “Order Flow +” items
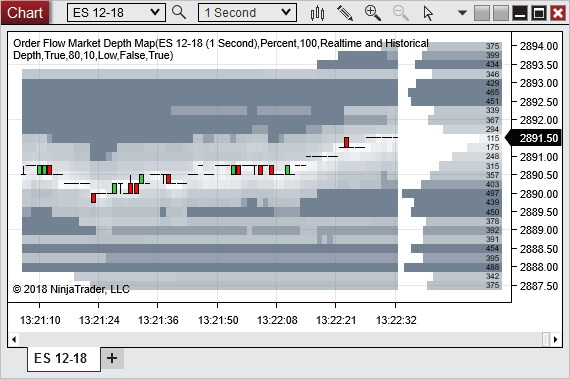
The Order Flow Depth Map now has a real-time display that graphs the current market depth for an easy visualization of where the highest resting volume is.

Following the rollout of the first “Order Flow +” tools on NinjaTrader early this year, the specialist in trade simulation, advanced charting, market analytics and backtesting continues to bolster these tools.
The latest version of the platform (8.0.16.0) adds more features to “Order Flow +” items.
Thus, for instance, the Order Flow Depth Map now has a real-time display that graphs the current market depth for an easy visualization of where the highest resting volume is.
Volumetric bars now have a profile view to easily identify where the largest volumes occurred.
Also, Order Flow Volume Profile using large composite modes such as month will build from the start of the month rather than a month back from the current date.
Let’s recall that the NinjaTrader Order Flow + studies are powerful tools to assist in order flow, volume and market depth analysis. They are included for all NinjaTrader lifetime license users. The lineup of such tools includes items like Order Flow Cumulative Delta – an indicator that accumulates the volume of orders filled at bid and ask prices or up and down ticks throughout the session or bar and compares them to determine buy/sell pressure, as well as Order Flow VWAP (Volume Weighted Average Price), which reflects the total of the dollars traded for every transaction (price multiplied by number of shares traded) and then divided by the total shares traded for the day.
The latest version of NinjaTrader comes with a raft of other improvements too. The platform offers traders to resize the Chart Trader – that is, the Chart Trader size can be adjusted according to one’s preferences.
Traders now also have the ability to save templates for indicators to more easily manage different configurations of indicators.
Furthermore, Fibonacci and Camarilla Pivots have been added. Pivot indicators calculate areas of potential support and resistance based on values from the prior trading session.
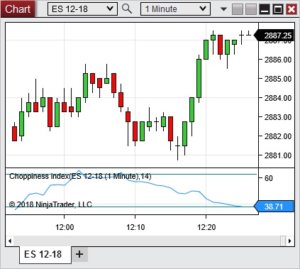
Choppiness Index is now available. This is an indicator that determines if the market is choppy (trading sideways) or not choppy (trading within a trend in either direction). A high value is more choppy. A lower value indicates the market is trending.
Vortex has been added. This is an oscillator that may be used to identify trends. A bullish signal triggers when the VIPlus line crosses above the VIMinus line. A bearish signal triggers when the VIMinus line crosses above the VIPlus line.
The list of additions continues with Block volume, which can track how many block trades occurred within a bar. It can display the number of block trades or the total volume of the block trades. This could even be used to count how many ticks occurred within a bar. Historical tick data is required to historically calculate this indicator.
Finally, let’s mention the addition of Psychological Line, which displays a ratio of what percent of bars were up bars over a specified number of bars. A higher ratio may indicate the price is more likely to drop. A lower ratio may indicate the price is more likely to rise.