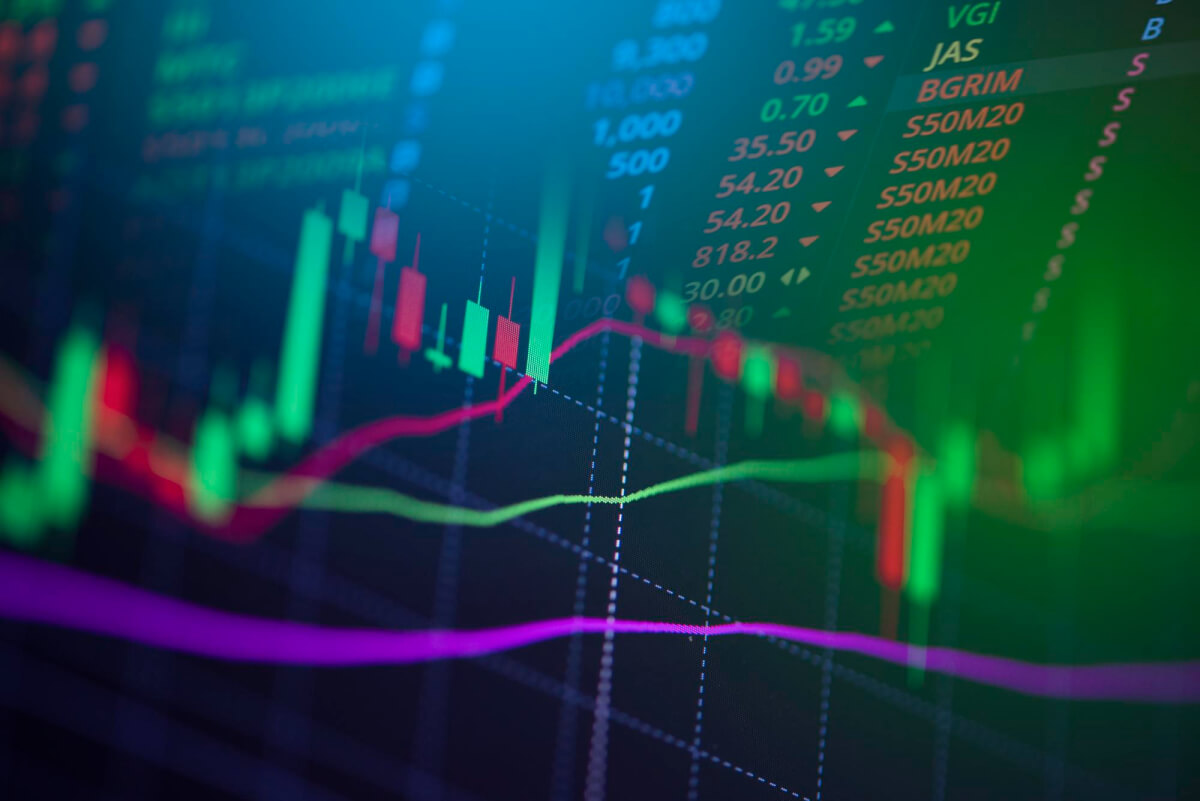
In the fast and dynamic world of trading, charting is one of the most important tools that traders use in the assessment of the market trends. Charts are important to traders because they assist in the display of large data in a more workable format. Charting can be of great help to the trader as it provides information which cannot be derived from figures.
The first advantage of charting is that it makes data analysis easy. There are many types of charts that exist, and a trader can decide on which one he or she wants to use. In trading, there are various types of charts and some of the most common ones are line chart, bar chart and candle stick chart. Each of them offers a different view of the market data that the trader may use to analyze the data in a manner that best suits him.
The initial form of charting tools is line chart that depicts the closing price of an asset over a given period. It is particularly helpful when it comes to the long-term trends and getting the big picture of the price action. Nonetheless, line charts cannot illustrate changes in prices within a particular period and are thus not very useful in short-term trading.
Line charts are less detailed than bar charts as they only show the opening, closing, high and low values of the particular period. The vertical line in each bar is a single time frame where the top and bottom of the bar represent the highest and lowest price respectively. The two horizontal lines above and below the bar depict the opening and closing prices respectively. The bar charts are useful in the study of the fluctuations in the markets and the recognition of trends in a short period.
Candlestick charts which are popular among traders contain much information about the price movement in quite a simple manner. A candlestick is also a graphical representation of price movements in a particular trading period and has the same elements as the bar chart but in a more artistic form. The main body of the candlestick is the vertical line which is the range of the opening and closing price; the upper and lower part of the candlestick is called the wick which is the range of the highest and lowest price. If the candle is filled or colored then it is a bearish period when the closing price is below the opening price, and if the candle is hollow or uncolored then it is a bullish period when the closing price is above the opening price. Candlestick charts are most useful in studying the trends in the market and the probable reversal points.
Technical analysis also involves the use of indicators that assist the trader in analyzing the information presented in thecharts. Some of the most widely used indicators are the moving average, the relative strength index (RSI), and the Bollinger Bands. The moving averages show the direction of the price changes while the RSI shows the rate of price changes in order to assess the level of over-bought or over-sold. Compared to volatility, Bollinger Bands are significant because they present a moving average of bands that are positioned to show possible breakout.
However, to get the best results, traders should use more than one type of chart and more than one indicator. This makes the system more effective and flexible as it enables traders to cross check the signals and make better decisions. However, the technical analysis can be complemented by the information about the economic conditions and certain events in stock exchange market.
In conclusion, it is possible to conclude that charting is one of the most important tools for every trader who is going to meet the difficulties of financial markets. The charts and technical indicators are very useful in analyzing the markets and the price movements among the traders. Such knowledge helps traders to make the right decisions, to establish the right strategies for trading and, therefore, enhance their performance of the trade activities. It will always be helpful for any trader irrespective of the level of experience that he or she possesses to learn the right way of using charts.