GAIN Capital’s GetGo app introduces Trade Mapping feature
Trade Mapping aims to provide GetGo users with a clever way to analyze previous trades.

The GetGo mobile app, which has recently been made available in Australia by online trading major GAIN Capital, continues to enjoy enhancements. The latest update to the solution introduces Trade Mapping – a feature that aims to provide GetGo users with a clever way to analyze previous trades.
Traders will find a Trade Map for each closed trade under the Overview tab in the “Your Performance” section. Tapping on a closed trade expands this feature and allows traders to see a price chart showing the trade’s lifecycle in full.
The main three price points of one’s trade are on the vertical axis. There is a dotted horizontal line, which represents the market price where one’s trade was at break-even point, a solid line showing one’s Max Loss, and another solid line showing one’s Profit Target (if a trader has set one). The signal time window is shown along the bottom of the chart.
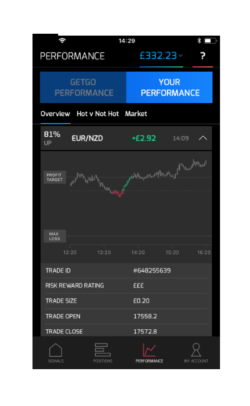 The small vertical bars display the price movement of the market a user has traded during the entire signal time window – the red and green bars are the Trade Map, i.e. when one’s trade was live. Each bar represents a 2 minute period and the top and bottom of the bar represent how high or low the market went during that time. Where the bars are red one’s trade was loss-making, and where green one’s trade was profitable.
The grey bars before the colored ones show how the market moved before one’s trade went live, while those after the green or red ones represent how the market moved after one’s trade closed.
For an UP trade, the colored bars will be green above the dotted break-even line, and red below it, that is the trade goes into profit if the price moves above break-even level (UP). For a DOWN trade the reverse will be true and the bars will be green below the break-even line (DOWN) and red above it.
Users of the app can find other useful information about each trade below the trade maps. This information includes, for instance, the highest profit level the trade actually reached, representing the max a trader could have made (HIGH), and the worst loss level during the trade, which is the max loss a trader could have incurred (LOW).
The GetGo team explains that Trade Mapping will be useful for those traders who like to analyze and adjust their strategies accordingly. Depending on how and when traders close their trades, they may not always be capturing as much of profits as possible. Using the Trade Mapping new feature, users of the app can now go back and analyze their trades to see exactly when closing them would have made them lose the most money, or how they could have avoided a loss. If they find that they have been consistently missing out on extra profit, they may want to consider changing their trade management style.
The GetGo app leverages the capabilities of a smart AI-enhanced algorithm to spot statistical trends in financial markets and provide users with trading signals based on historical data. GetGo’s algorithm reads through millions of data points across global indices, currency and commodities markets looking for price patterns that have led to consistent trading outcomes in the past. When it spots a pattern it thinks might repeat, it pings a user a signal. Then traders have to decide: GetGo or No-Go? And that is where the app gets its name from.