IG trading platform makes Heikin-Ashi candles available to traders
Heikin-Ashi candles are now available on the IG trading platform for both desktop and mobile.

Online trading major IG Group continues to enhance the charting capabilities of its trading platforms. Heikin-Ashi candles are now available on the IG trading platform for both desktop and mobile. The IG team explains that this feature has been one of the highly requested additions to charts as these types of candles are commonly used by traders looking at identifying trends visually without the need of complex analysis.
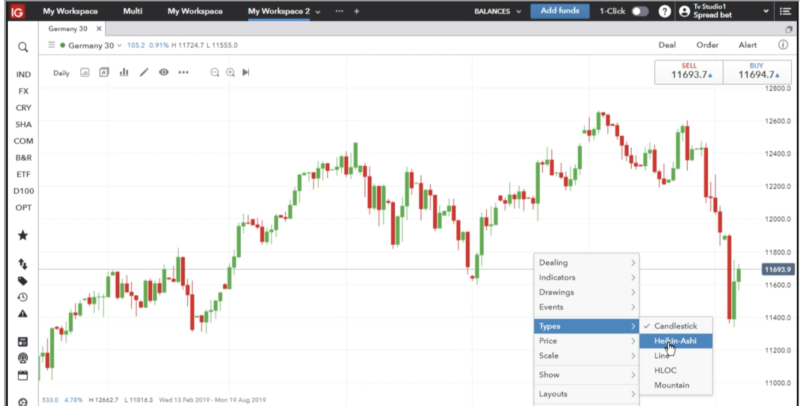
To turn on Heikin-Ashi candles:
- Open the main menu by right clicking on the charts;
- Navigate to “Types” and bring up the second menu list;
- Select “Heikin-Ashi” – the candles will appear straight away.
Heikin Ashi (HA) price charts are derived from conventional candlestick charts. Each HA candle will display an open high low and close value, although unlike a regular candlestick, which uses only data from the current session, the HA candle will use data from the current and previous session to derive its values.
In terms of the HA candle appearance:
- The high is the highest value on the HA candle;
- The low is the lowest value on the HA candle;
- If the candle is green, the closing value is greater than the opening value and is represented at the top of the coloured area of the HA candle;
- If the candle is red, the closing value is lower than the opening value and is represented at the bottom of the coloured area of the HA candle.
The primary use of HA candles is to indicate a directional market trend.
Last month, IG enabled traders to see their working order shaping up on the charts as they start creating orders from the ticket. To make use of this functionality, simply input your order direction, size and level and you will be able to see a preview on the chart. You can then decide to drag you Stop and/or Limit from the chart to define their absolute level and see the related Risk/Reward Ratio. Once you are satisfied with this just place your order from the ticket.
IG has recently made switching between different intervals on the IG desktop charts easier. Traders who would like to change intervals (from 1 minute candlesticks to 5 or 10 minute candles, or to hours, days or months) can make use of keyboard shortcuts. Whilst on a chart a trader can type any number from 1 to 5 on the keyboard to bring up a small ‘interval’ dialogue box. Then the trader needs to confirm the choice, and hit enter.