Interactive Brokers adds Implied Volatility “Percentile”and “Rank” data points to TWS platform
The broker has added 24 new data points to TWS that traders can display as columns in their Portfolio, Watchlists and Scanners.
Online trading services provider Interactive Brokers Group, Inc. (IEX:IBKR) has introduced more enhancements to its TWS platform. In the latest (beta) version of the solution, the broker has added 24 new data points that traders can display as columns in their Portfolio, Watchlists and Scanners.
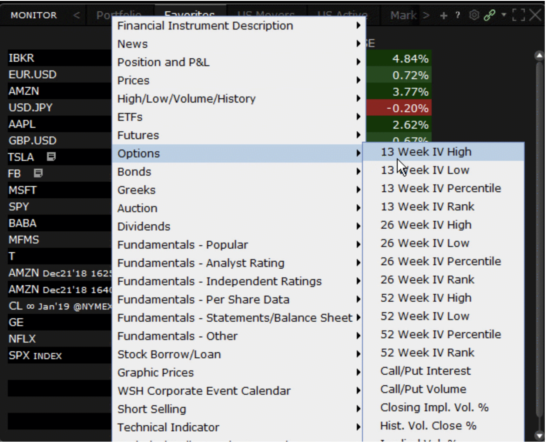
Implied Volatility (IV) data points for options include IV Percentile, IV Rank, IV High and IV Low, for 13, 26 and 52 week periods.
- The IV Percentile data points indicate the percentage of days with implied volatility closing below the current implied volatility over the selected period.
- The IV Rank data points indicate where the implied volatility ranks between the selected period’s high and low. A low rank indicates that the current value is closer to its period low.
- The IV High and IV Low data points show the maximum and minimum closing value (respectively) of the implied volatility over the selected time period.
To add Implied Volatility data columns to a TWS window, traders have to hold the mouse over an existing column name until the Insert Column command appears. Then, they have to click Insert Column and scroll to the Options column group. If they hold the mouse over a title in the group, they will see the tooltip definition. Clicking a title will result in adding the column to one’s window.
Historical Volatility (HV) data points include HV Percentile, HV Rank, HV High and HV Low, for 13, 26 and 52 week periods.
- The HV Percentile data points indicate the percentage of days with historical volatility closing below the current implied volatility over the selected period.
- The HV Rank data points indicate where the historical volatility ranks between the selected period’s high and low. A low rank indicates that the current value is closer to its period low.
- The HV High and HV Low data points show the maximum and minimum closing value (respectively) of the 30-day historical volatility over the selected time period.
To add Historical Volatility data columns to a TWS window, traders have to hold the mouse over an existing column name until the Insert Column command appears. Click Insert Column and scroll to the Prices column group. Hold the mouse over a title in the group to see the tooltip definition. Click a title to add the column to your window.
Let’s recall that, in April this year, Interactive Brokers bolstered its 3D Volatility Surface webtool. Traders got the ability to view Implied Volatility in 3D using the 3D Volatility Surface webtool accessible from within the Implied Volatility Viewer. All they have to do is click the “3D” button to study the model volatility surface of contracts in 3D.
As a result, the platform displays the model surface together with individual option IV points. And traders can also compare the current surface with any historical value by plotting them together. The view can be rotated and zoomed.