Interactive Brokers adds Risk Navigator what-if cash adjustment to TWS platform
The Risk Navigator (SM) “what-if” portfolio will now treat actions to add, remove or change existing positions just like simulated buy/sell orders, and keep the Net Liquidation Value of one’s portfolio as if in response to an actual trade.
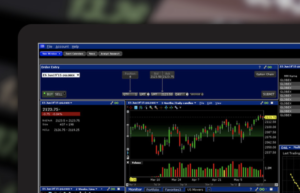
Online trading major Interactive Brokers continues to beef up the capabilities of the TWS platform. The latest enhancements concern Risk Navigator Cash Adjustment, which now treats position changes like virtual trades, and adjusts the cash in one’s what-if portfolio accordingly.
The Risk Navigator (SM) “what-if” portfolio will now treat actions to add, remove or change existing positions just like simulated buy/sell orders, and keep the Net Liquidation Value of one’s portfolio as if in response to an actual trade, to act more like a real account. Alternatively, traders can change the configuration to allow basic position changes that will affect the NLV or to ask each time, from the Settings menu using What-if Cash Adjustment. One can consider setting an initial cash amount for a new what-if portfolio, or update the cash amount at any time.
The latest (beta) version of the platform also offers traders enhanced access to company fundamentals data on stocks and mutual funds via the Fundamentals Explorer.
The functionality aims to help traders better gauge the fundamental value of an asset. The explorer includes Company Profile, Financials, ESG Rating, Key Ratios, Competitors and more.
The company has added more than 200 new company and ETF ratios including graphical trends to show how key financial ratios have trended in the past five years and comparisons to peers within the same Thomson Reuters Business Classifications. Traders can expand on the ratio to view a bubble chart comparing the same ratio against four peers with the nearest market capitalization, and compare ratio trend values with a peer. Traders can also select a competitor to continue their fundamentals research.
On top of hundreds of fundamentals data values, the brokerage now provides a cross-link between company reported statement filings and analyst forecasts for key values, and has added graphical charts to help traders quickly assess data trends and surprises to analyst’s estimates.