Latest version of NinjaTrader extends “Order Flow +” lineup
The newest version of the platform gets equipped with Order Flow Volume Profile Indicator & Drawing Tool.
After the release of the first “Order Flow +” tools on NinjaTrader earlier this year, the specialist in trade simulation, advanced charting, market analytics and backtesting is now expanding the suite of such tools.
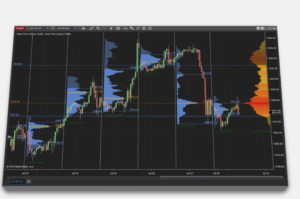
The latest version (8.0.15.0) of the platform is equipped with a number of new indicators and drawing tools that are set to appeal to tech analysis fans. NinjaTrader now offers Order Flow Volume Profile Indicator & Drawing Tool. This is a comprehensive advanced analysis technique that displays the distribution of trading volume over price for a specified time range revealing significant levels of support and resistance. The tools offer:
- Multiple visualization modes;
- Plot volume, delta, ticks or price;
- Display point of control and value areas.
The platform now also enables traders to make use of Polygon drawing tool and Time Cycles drawing tool. The Time Cycle is an analytical drawing tool used to identify cyclical price activity – repeating high and low price patterns. This analysis is based on the premise that a market’s price activity behaves in patterns.
NinjaTrader has also added the McClellan Oscillator indicator. This is one of the handful of indicators that are based on market metrics other than price. The McClellan Oscillator provides an indicator based on market breadth which technical analysts can use in combination with other market variables to generate profitable trade orders.
The latest version of NinjaTrader also makes the Relative Vigor Index (RVI) indicator available to users of the platform. This is a technical analysis indicator that measures the strength of a trend by comparing a security’s closing price to its price range and smoothing the results using an exponential moving average (EMA). The analysis is based on the assumption that prices tend to close higher than they open in uptrends, and closer lower than they open in downtrends.
The latest platform release also adds the “wise men” indicators. The Awesome Oscillator is an indicator used to measure market momentum, whereas the Alligator indicator (a combination of Balance Lines) uses fractal geometry and nonlinear dynamics to show the interaction of different time periods. The Fractal indicator helps to identify breakouts on previous high or low. Each fractal represents the end of an Elliot Wave and a breakthrough of each fractal marks a new impulsive wave.