IG enhances work with charts on web trading platform
Traders get the opportunity to partially close positions via charts and to see a watermark with the market name in the background of the charts.

Electronic trading major IG Group Holdings plc (LON:IGG) has recently made some enhancements to its offering, including addition of new functionalities on charts.
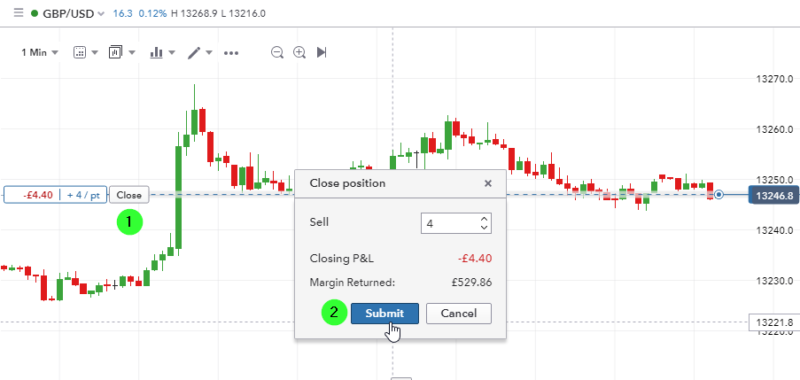
- Partially close positions via charts
This new feature is available on charts for both the web trading platform and on mobile. When ‘1-click dealing’ is not enabled, traders are able to confirm whether or not they want to close the whole position, or to partially close via a pop up dialogue box. To use this functionality, traders must click ‘close’ (1) on the chart, change the ‘Sell’ value (for example in the screenshot below they can change 4 to 2 to only close half the position), followed by ‘Submit’. The window will show the ‘Closing P&L’ as well as the ‘Margin Returned’.
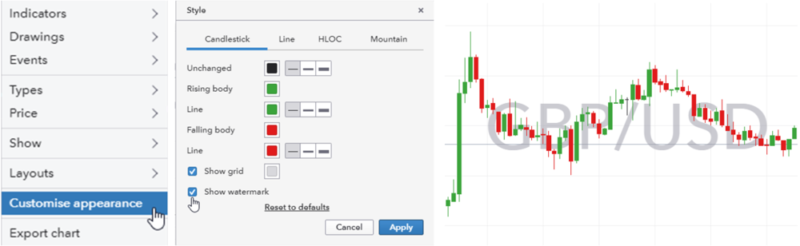
- Market name watermarks for all charts
To add clarity and ease of use it is now possible to display the name of the market in the background of the charts. This feature is disabled by default but can be activated from the “customise appearance” menu which is brought up by right clicking on the chart, ticking the “show watermark” checkbox, and clicking ‘Apply’. Once activated every charts will start showing the market name. The watermark will also be displayed on the image produced using the “export chart” option.
This perk is supposed to be pretty useful for those who have several charts open at the same time, as well as for those who share their chart set ups online, with friends, and on IG Community.
Let’s note that IG has been regularly bolstering the functionalities related to the charts on its new platform. For instance, in February this year, the broker introduced some enhancements to its new web trading platform, allowing better customization of charts and easier access to HLOC (High, Low, Open, Close) data.
The company has received a lot of suggestions to have the HLOC data display by default on the charts instead of having to right click and go to Show->HLOC Data. In response to the demand, IG has implemented this change. As a result, by opening a chart traders should now see the HLOC data display as a default. They can still hide this data by right clicking->Show->HLOC Data.
In April, the broker added a new “Go To” feature to its web platform charts. It allows users to search for a specific date (and time) on a chart in a few simple clicks. The charts will then automatically centre on the searched date/time requested by the user. And in May this year, IG improved this feature. Traders got the abillity to see where on the charts is the candle/point in time that they searched for. This information showing the date/time will stay on the screen a few seconds before fading away.