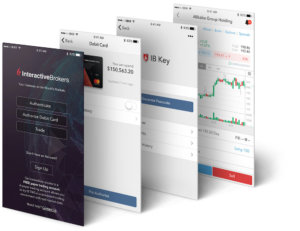
Interactive Brokers adds Econoday data to Calendar on IBKR Mobile app
The Event Calendar now includes institutional-quality global economic events data by Econoday.

Online trading major Interactive Brokers Group, Inc. (IEX:IBKR) continues to enhance the functionalities of its mobile applications, with the latest set of enhancements concerning the Calendar feature.
The Event Calendar which is available on IBKR Mobile for iOS and Android devices now includes institutional-quality global economic events data by Econoday. Their senior economists provide jargon-free, market-focused highlights for each event, which traders can read by tapping an event headline to expand.
To disable Econoday Events, traders should simply tap the gear icon in the top right corner of the Event Calendar screen and use the Econoday Events toggle to disable (and enable) this data.
In September, IBKR Mobile gave traders the ability to stream live Bloomberg TV thanks to the new Media tab. It is available in the News/Media tool, along with Portfolio news. In addition, advisors got to see complex, multi-leg positions in their portfolio.
Trades display has also been beefed up, as traders can now view up to seven days of trades (instead of just today’s trades) on the Trades screen.
The version of IBKR Mobile for Android gadgets which was released in August introduced improvements to Order Entry. Users of the solution got the ability to quickly access Order Entry or view their orders and trades with the new Trader Launchpad button. When traders tap the round, green icon from the Watchlist or Portfolio screen, they can then choose to create a buy or sell order, search a quote, or see details for recent quotes. Also, a new section in Order Entry shows the account’s Buying Power and asset position.
Speaking of novelties concerning Interactive Brokers’ trading solutions, let’s mention the latest TWS (beta) build which introduces Thomson Reuters ESG reference data points and scores. The Environmental, Social and Governance (ESG) scores and data points can be displayed in TWS as market data columns, and viewed as a graphical indicator displaying an overall score between 0 – 100%, with a breakdown of category (pillar) scores available when you hover over the ESG Overall score.


